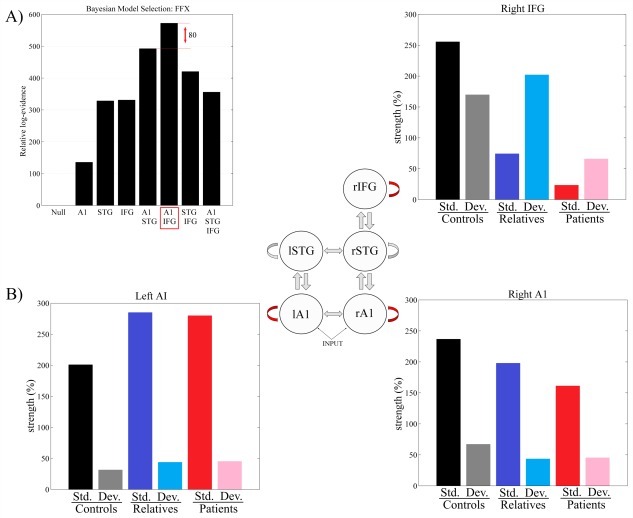
Figure 4.

(A) Bayesian model selection results investigating intrinsic (inhibitory) modulations at different levels of the hierarchy. Log model evidences relative to the null model are shown. The winning model has modulations at A1 and IFG, and the difference in log evidence between this and the runner‐up is 80. (B) Changes in intrinsic connectivity strengths under the winning model, at each source, for patients, relatives and controls, and for standard (std.) and deviant (dev.) trials. A1 = primary auditory cortex; STG = superior temporal gyrus; IFG = inferior frontal gyrus; l = left hemisphere; r = right hemisphere. [Color figure can be viewed in the online issue, which is available at http://wileyonlinelibrary.com.]
