Figure 1.

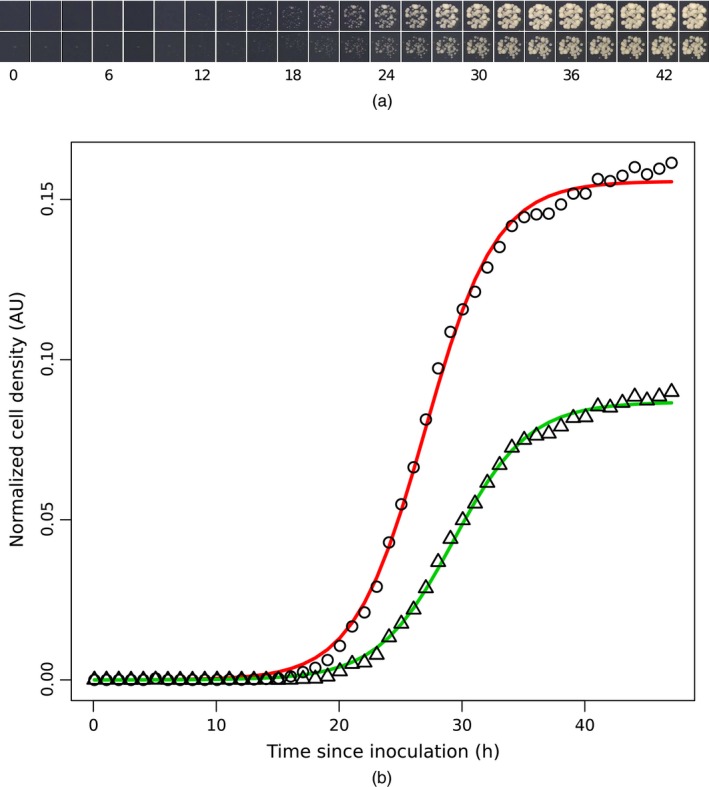
QFA image data and growth curves: (a) time lapse images for two genetically modified S. cerevisiae with genotypes his3Δ (∘, upper photographs) and htz1Δ (▵, lower photographs) corresponding to the time series measurements plotted in (b) time course cell density estimates derived from analysis of the time lapse images in (a) together with (least squares) fitted logistic growth curves
