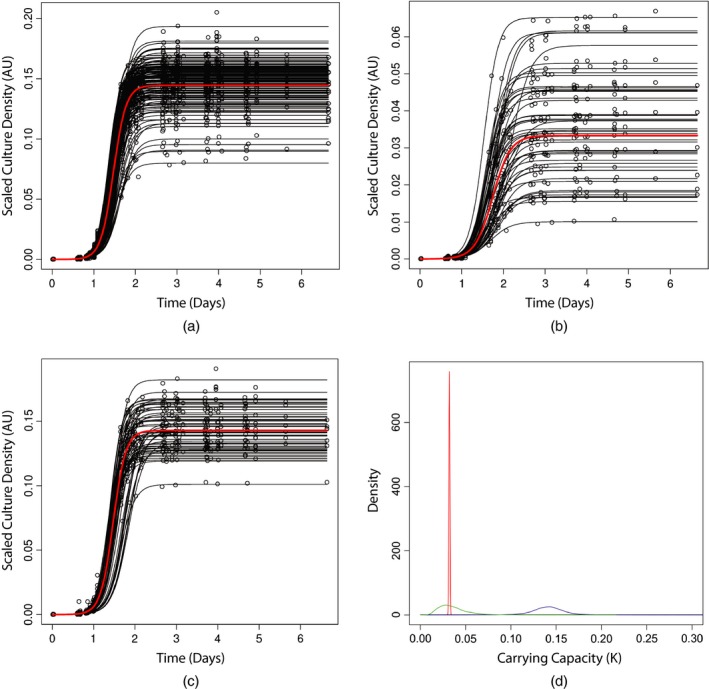
Figure 2.

Hierarchy of model fits and parameter estimates (data for orfΔ repeats have been plotted in (a), (b) and (c) with SHM‐fitted curves overlaid in black for repeat level parameters and red for the orfΔ level parameter fit): (a) SHM scatter plot for 144 his3Δ ura3Δ repeats at C; (b) SHM scatter plot for 48 rad50Δ ura3Δ repeats at 27C; (c) SHM scatter plot for 56 exo1Δ ura3Δ repeats at C; (d) SHM density plot of posterior predictive distributions for rad50Δ ura3Δ carrying capacity K hierarchy (the prior distribution for is flat over this range; parameters , and are on the same scale as the observed data) ( , posterior predictive for ;
  , posterior predictive for ;
  , posterior distribution of the first time course repeat ‐parameter)
