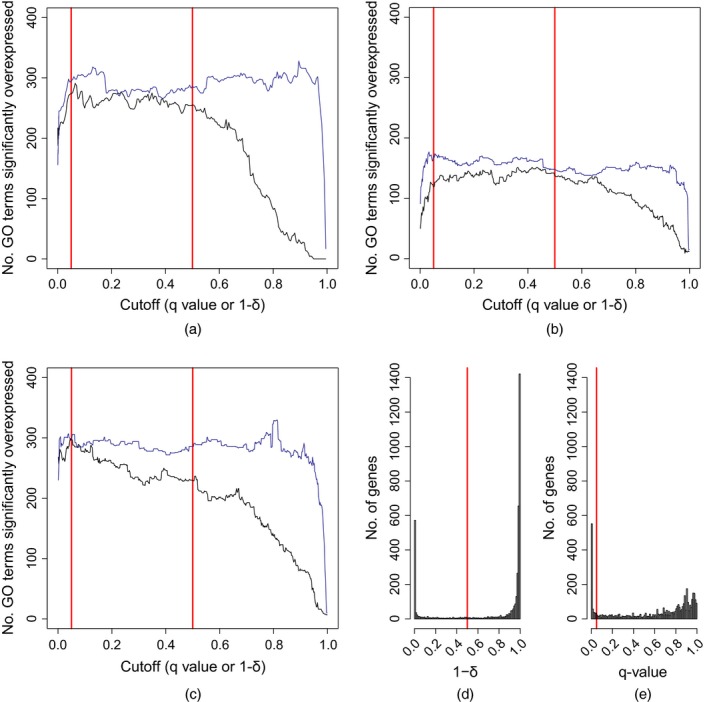
Figure 5.

Sensitivity to significance thresholds: (a)–(c) comparison of the number of significantly overexpressed GO terms expressed in lists of significant interactors found by using the method of Addinall et al. (2011) ( ), and by using the JHM (
 ), and frequency histograms showing distributions of classifier values after looking for genes interacting with cdc13‐1 at 27 C by using (d) the JHM or (e) the method of Addinall et al. (2011)
