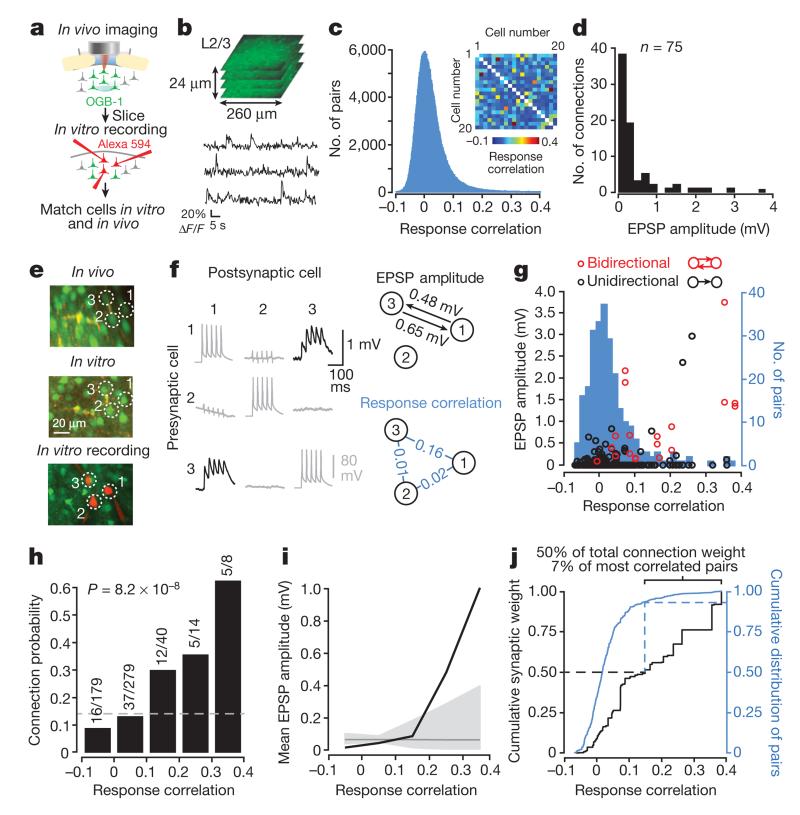
Figure 1. Excitatory connection strength reflects the similarity of pyramidal cell firing in vivo.
a, Schematic of experimental protocol. b, Somatic calcium signals were sampled simultaneously from all neurons within a small volume of cortex (~260 × 260 × 24 μm). Two such volumes were recorded in each experiment. c, The distribution of pairwise response correlation coefficients for all imaged cell pairs. Inset, example matrix of correlation coefficients of pairwise responses from 20 neurons within a single imaged volume. d, Distribution of excitatory postsynaptic potential (EPSP) amplitudes (n = 75 connections). e, Example triplet of neurons shown in a transformed in vivo image (upper), in the brain slice (middle) and during whole-cell recordings (lower). f, Left, average postsynaptic potential traces of neurons in e. Black traces, connected; grey traces, unconnected; evoked presynaptic spikes are along the diagonal. In some traces, capacitative stimulation artefacts coincide with presynaptic spikes. Right, synaptic connectivity and response correlation coefficients of neurons in e. g, EPSP amplitude plotted against pairwise response correlation coefficient for bidirectionally (red) and unidirectionally (black) connected pairs. Underlying histogram shows the distribution of pairwise response correlation coefficients (blue, right y axis). h, Relationship between connection probability and pairwise response correlation. Grey dashed line, mean connection probability. Connection probability increased with response correlation (P = 8.2 × 10⁻⁸; Cochran–Armitage test). i, Mean connection amplitude (including unconnected pairs) plotted against response correlation (bin size = 0.1). Grey line, mean EPSP amplitude of all pairs. Grey shaded region represents the 95% confidence interval of the expected mean, estimated by repeated random reshuffling of the EPSP amplitudes among all cell pairs in the data set. j, Black trace, cumulative distribution of synaptic weight with respect to response correlation. A value of 1 corresponds to the linear sum of all EPSPs (33.34 mV). Blue trace, cumulative distribution of pairwise response correlation coefficients (right y axis).

