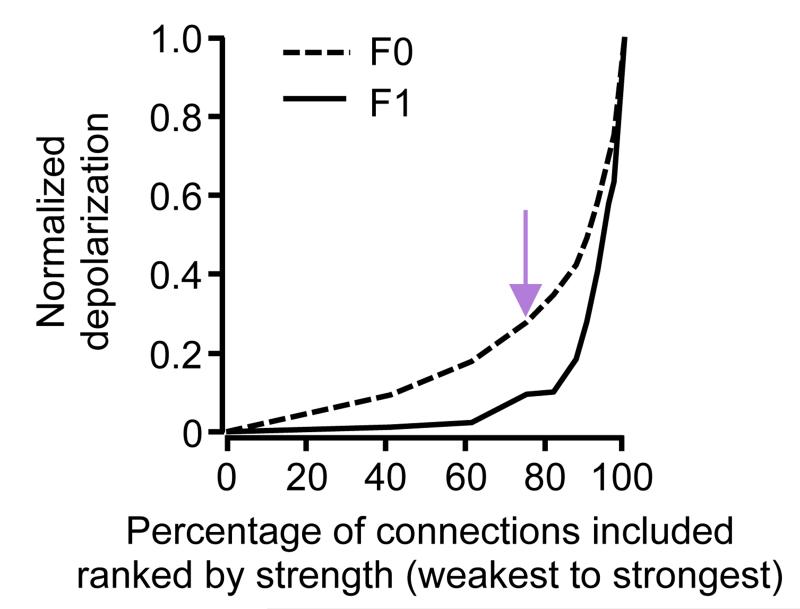
Extended Data Figure 9. Contribution of strong and weak connections to membrane potential depolarization.
Removal of an increasingly larger fraction of the strongest inputs from the L2/3 model steeply reduces the large modulation component (F1) but more gradually reduces the mean depolarization component (F0). Model from Fig. 4d. Purple arrow indicates the weakest 75% of connections, as shown in Fig. 4i, j.

