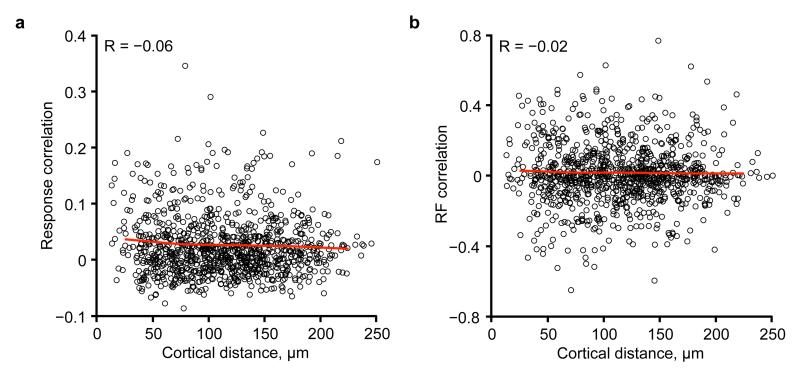
Extended Data Figure 1. Relationship between response correlation coefficient or RF correlation and cortical distance.
a, Pairwise response correlation coefficient plotted as a function of cortical distance, for an example region, indicates only a weak relationship between response correlation and cortical distance (R = −0.06). Red line denotes mean value of response correlation in 50 μm bins of cortical distance. b, Pairwise RF correlation plotted as a function of cortical distance, for the same example region as in a. Again, only a weak relationship was observed (R = −0.02).

