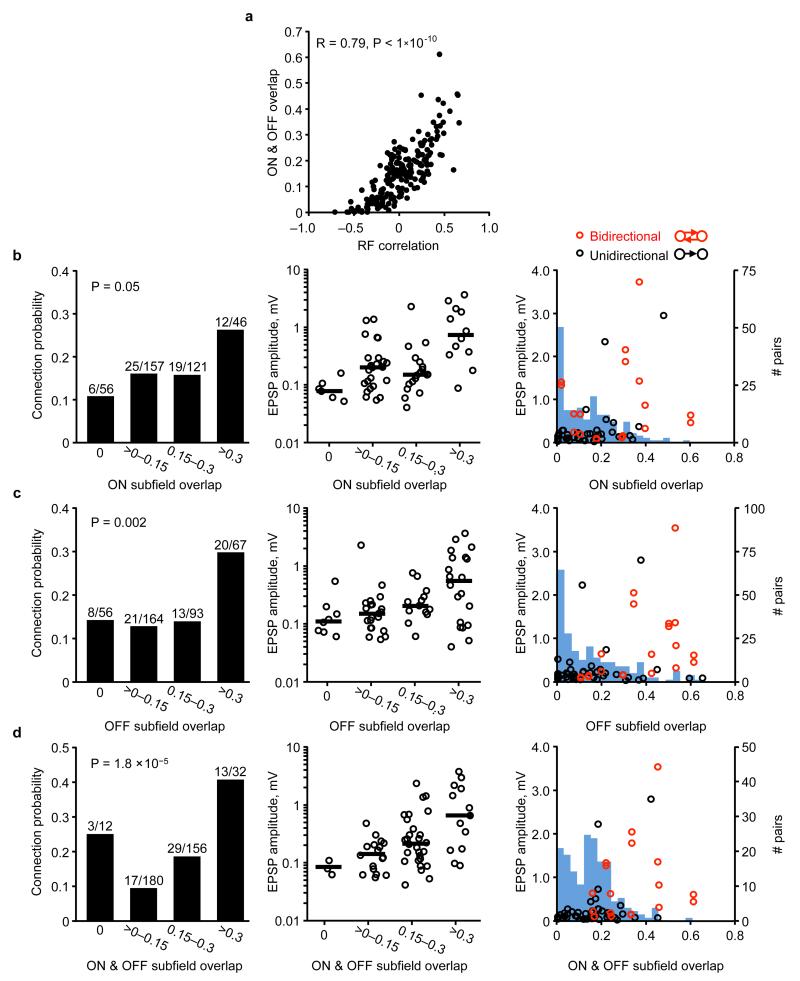
Extended Data Figure 3. Relationship between connectivity and RF subfield overlap.
a, The amount of ON and OFF subfield overlap (see Methods) was strongly correlated to the overall RF similarity as measured by RF correlation (R = 0.79, P < 1 × 10⁻¹⁰). b, Left panel, connection probability increased with increasing ON subfield overlap (P = 0.05; Cochran–Armitage test). Middle panel, EPSP amplitudes categorized into bins of ON overlap. Black line, median EPSP amplitude for each bin. Right panel, EPSP amplitude plotted against ON overlap. Red data points, bidirectional connections. Black data points, unidirectional connections. Underlying histogram shows frequency of recorded cell pairs as a function of ON overlap. c, Same as b, but for OFF overlap (P = 0.002; Cochran–Armitage test). d, Same as b, but for combined ON and OFF overlap (P = 1.8 × 10⁻⁵; Cochran–Armitage test). P values from the Cochran–Armitage test. To perform the Cochran–Armitage test, the bins at 0 and >0–0.15 were considered together, so that groups were evenly spaced.

