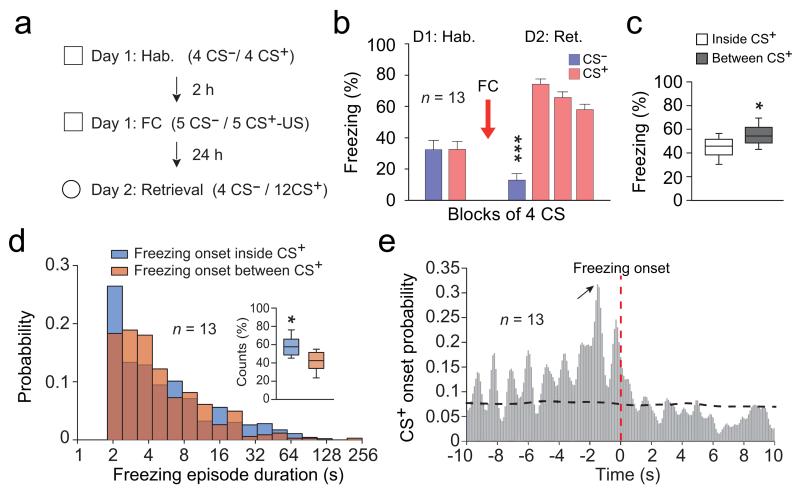
Figure 1. Freezing behaviour is triggered by internally generated mechanisms.
(a) Experimental protocol. (b) Behavioural results. During habituation (Hab.), mice (n = 13) exhibited low freezing during CS− and CS+. Following conditioning (Day 2: Retrieval), CS+ (CS+ 1-12 grouped in blocks of 4) induced high freezing in comparison to CS− (Paired t-tests, CS− versus each CS+ block: t(12) = −11.929; t(12) = −11.929; t(12) = −8.442, *** all Ps < 0.001). (c) Percentage of freezing exhibited during and between CS+ presentations (Paired t-test, freezing inside versus between CS+: t(12) = −2.480, * P = 0.029). (d) Distribution probability for freezing episode duration as a function of whether freezing was initiated inside or between CS+ presentations. Inset: Percentage of freezing episodes initiated inside or between CS+ presentations (n = 13 mice, Paired t-test, t(12) = 2.762, * P = 0.016). (e) Cross-correlation analysis performed between freezing and CS+ onset (n = 13 mice, 100 ms bins). Red vertical dotted line represents freezing onset. Black horizontal dotted line represents significance level. Black arrow indicates the highest probability for CS+ onset at 1.5 s prior freezing onset. Error bars: mean ± s.e.m. For box plots, the middle, bottom and top lines correspond to the median, lower quartile and upper quartile and whiskers to lower and upper extremes minus lower quartile and upper quartile, respectively..

