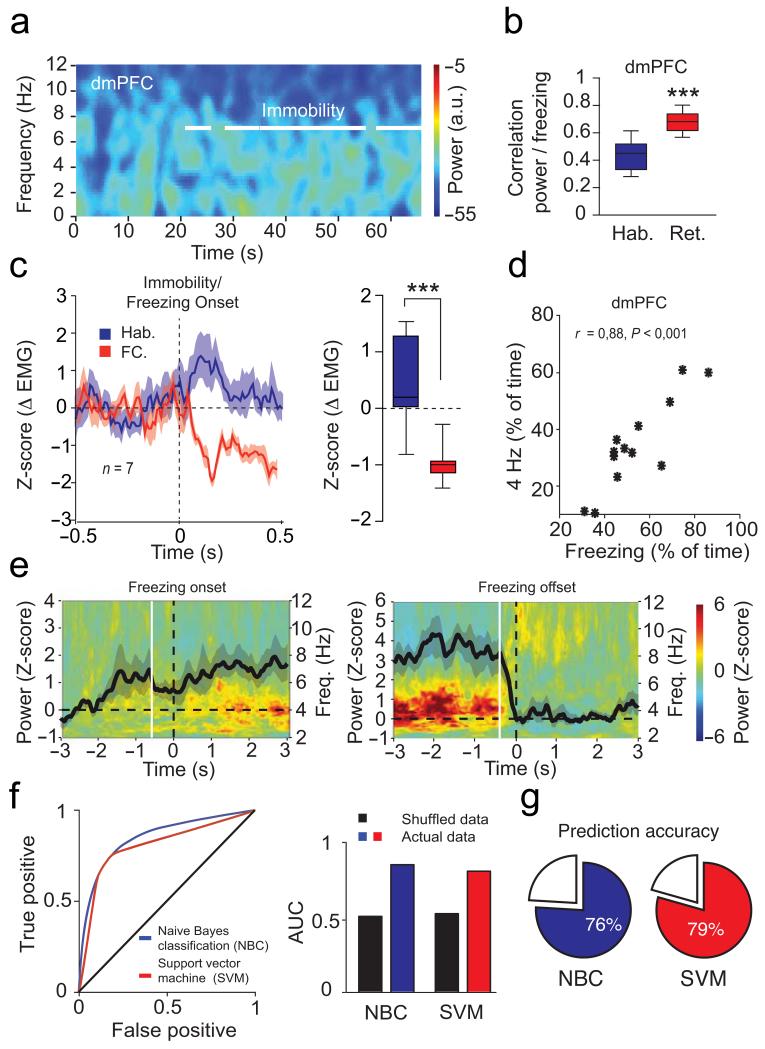
Figure 3. dmPFC 4 Hz predict freezing.
(a) Spectrograms of dmPFC LFP during Habituation (Hab.). White lines indicate immobility. (b) Correlation between dmPFC 4 Hz power and freezing during Hab. and Retrieval (n = 13 mice, paired t-tests: t(12) = 6.134, *** P < 0.001) (c) Left, Mean Z-score for neck electromyography (Δ EMG) during immobility/freezing (n = 7 mice) for CS+ presentations. Right, Averaged Δ EMG (0-500 ms post-CS+, Mann-Whitney U test, Hab. versus FC: U = 0, *** P < 0.001). (d) Correlation between freezing and dmPFC 4 Hz (n = 13 mice; Pearson’s r = 0.88, P < 0.001). (e) Averaged freezing onset (left) and offset (right) -triggered z-scored spectrograms of dmPFC LFPs (n = 13 mice; black lines: averaged z-scored power envelope; white lines: first significant bin of 4 Hz power changes (increase: −0.53 ± 0.31 sec; decrease: −0.39 ± 0.10 sec; one sample t-test: first significant bin versus hypothetical mean = 0, increase: t(12) = 19.207, P < 0.001; decrease: t(12) = 16.615, P < 0.001)). (f) Left, Receiver operating characteristics (ROC) analysis performed on Naïve Bayes (NBC) and Support Vector Machine (SVM) classifiers trained on dmPFC 4 Hz signal to noise ratio (SNR) during freezing. Right, averaged area under the curve for both classifiers versus shuffled data. (g) Accuracy of both classifiers to predict freezing. a.u.: arbitrary units. Power in log scale. Shaded areas and error bars: mean ± s.e.m. For box plots, the middle, bottom and top lines correspond to the median, lower and upper quartile and whiskers to lower and upper extremes minus lower quartile and upper quartile, respectively. For the representative example in (a), similar traces were observed for the 13 animals used in these experiments.

