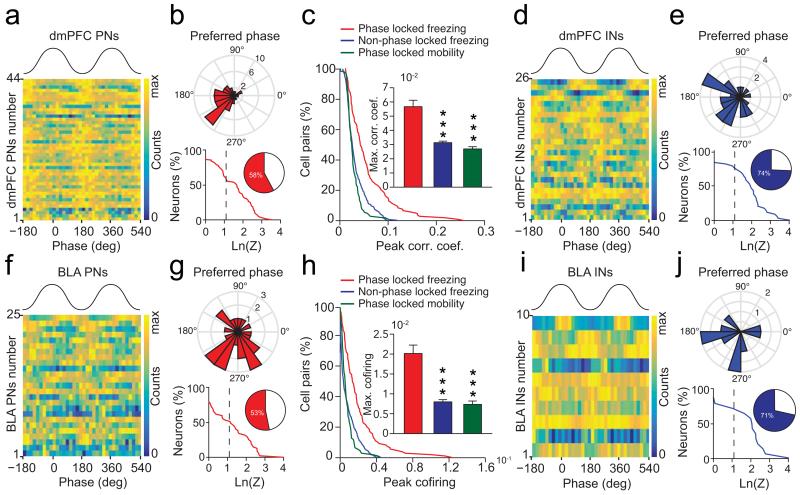
Figure 6. 4 Hz oscillations synchronize dmPFC-BLA spiking activity.
(a, d, f, i) Phase distribution relative to 4 Hz oscillations for dmPFC (a, d) and BLA (f, i) putative excitatory neurons (PN) (a, f) or putative inhibitory interneurons (IN) (d, i). (b, g, e, j) Circular distribution of the 4 Hz preferred phase for populations of dmPFC (b, e, top) and BLA (g, j, top) phase-locked PNs (b, g) and INs (e, j) during freezing (dmPFC: 44 PNs and 26 INs; BLA: 25 PNS and 10 INs) and cumulative distribution of log-transformed Rayleigh’s test Z of dmPFC (b, e, bottom) and BLA (g, j, bottom) PNs (b, g) and INs (e, j). Inset, percentage of dmPFC and BLA neurons significantly phase-locked to 4 Hz oscillations. Dashed line, significant 4 Hz phase locking threshold (ln(Z)= 1.097, * P < 0.05, dmPFC: 44/92 PNs and 26/35 INs; BLA: 25/72 PNs and 10/15 PNs). (c, h) Cumulative distribution of peak correlation coefficient (c) and co-firing index (h) for pairs of dmPFC and BLA phase-locked and not phase-locked neurons during freezing and mobility. Insets: Maximum correlation coefficient (c) and co-firing index (h) for all pairs of recorded dmPFC and BLA neurons (Phase-locked pairs: n = 180; Non Phase-locked pairs: n = 911, Mann-Whitney U test, top and bottom, phase-locked pairs during freezing versus mobility or non phase-locked pairs: U = 50313, 7893, 16200, 9413, ** P < 0.001, *** P < 0.001). Error bars: mean ± s.e.m.

