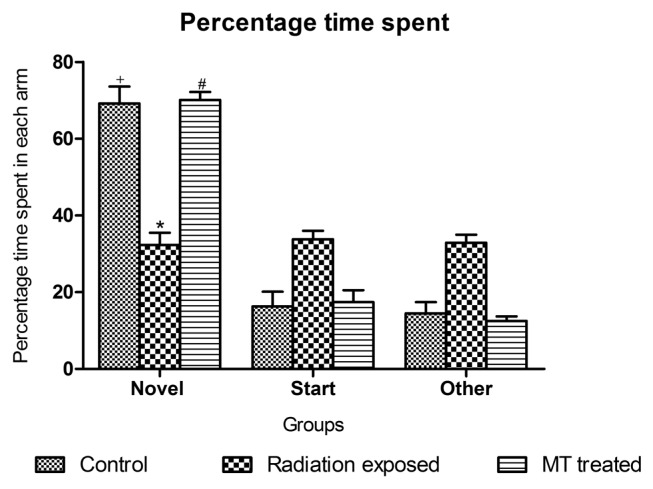
Fig. 6.
Effect of GSM900MP radiation exposure on percentage time spent in each arm of Y-Maze. The data is represented as the mean ± SEM (n = 40). Statistical analysis was performed by using one-way analysis of variance (ANOVA), followed by Newmen-Keuls test as a post-hoc analysis to identify significant differences among the groups. MT, Melatonin. *p < 0.05 versus control novel arm; +p< 0.05 versus start and other arm and #p < 0.05 versus radiation exposed novel arm.

