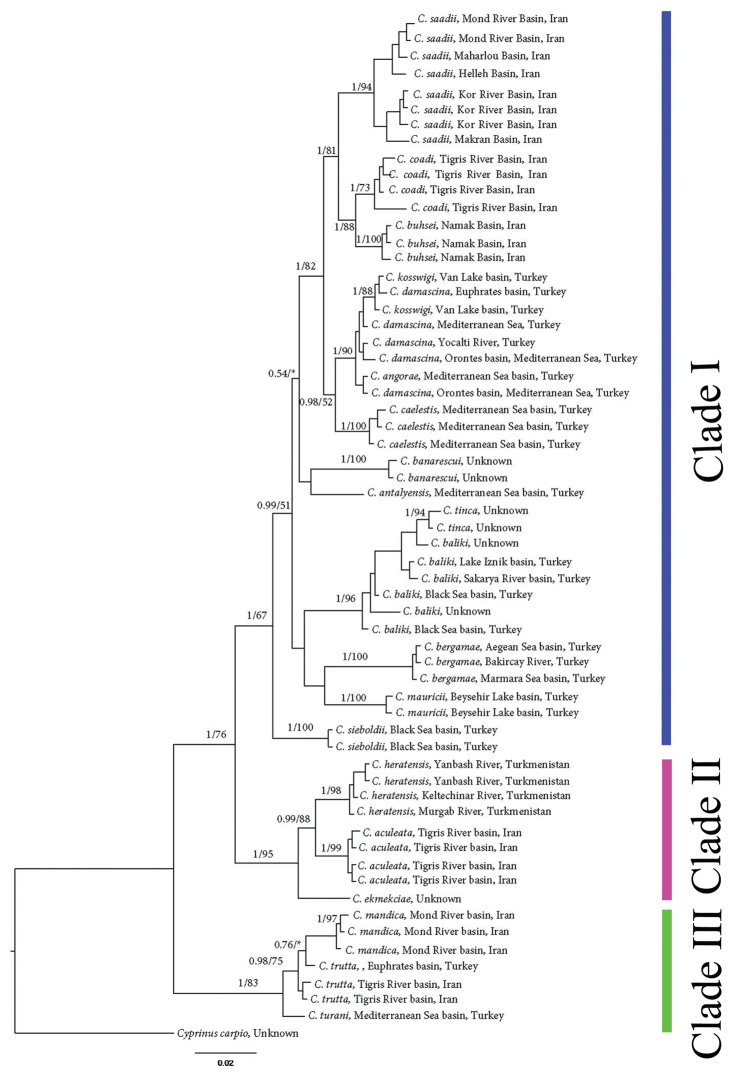
Figure 6.
Bayesian tree inferred from cyt b. Numbers left of the slash, indicate the posterior probabilities of the Bayesian analysis, using MrBayes, while numbers right of the slash are the bootstrap support for 10,000 replicates in the Maximum Likelihood tree, using RaxML. Asterisks (*) indicate less than 50% Maximum Likelihood support for the node.

