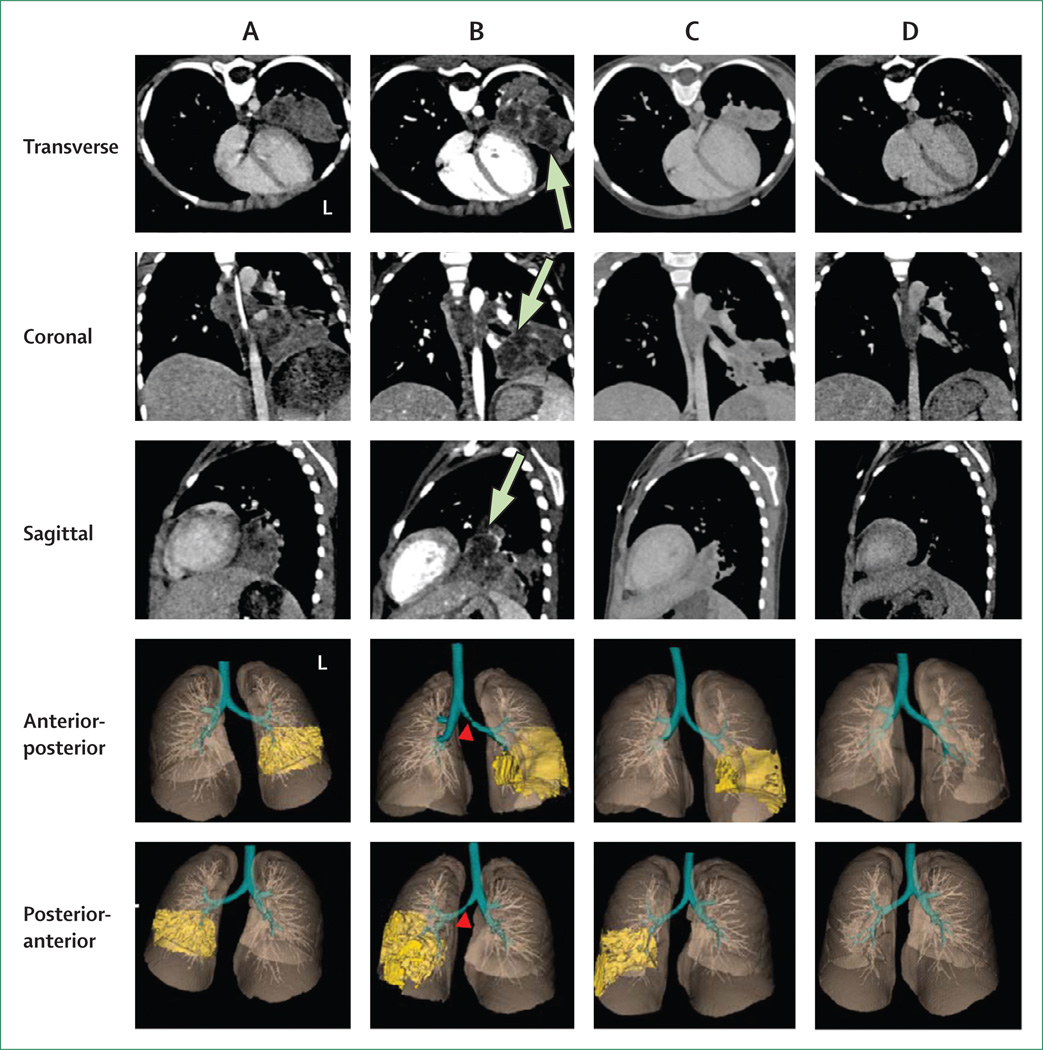
Figure 1. CT imaging.
CT imaging with intravenous contrast was done using the Definition FLASH (Siemens, Malvern, PA, USA) using a protocol customised for children. Lung segmentation and visualisation were done using VivoQuant 1·23 (inviCRO, Boston, MA, USA). The transverse, coronal, sagittal, and 3D views of the lung parenchyma and the pulmonary infiltrates in the left lung are shown. Each panel corresponds to CT done at: initiation of first-line tuberculosis treatment (A, day 0); initiation of individualised extensively drug-resistant (XDR) tuberculosis treatment (B, day 90); and 6 weeks (C, day 131) and 6 months (D, day 270) after initiation of XDR tuberculosis treatment. Several necrotic (hypodense) central areas can be seen in B (green arrows). Note the partial obstruction of the left main bronchus in B (red arrowheads). Marked improvement with resolution of necrotic areas is noted after 6 weeks (C) and near complete resolution of the infiltrate after 6 months (D) of XDR tuberculosis treatment. L = left side.

