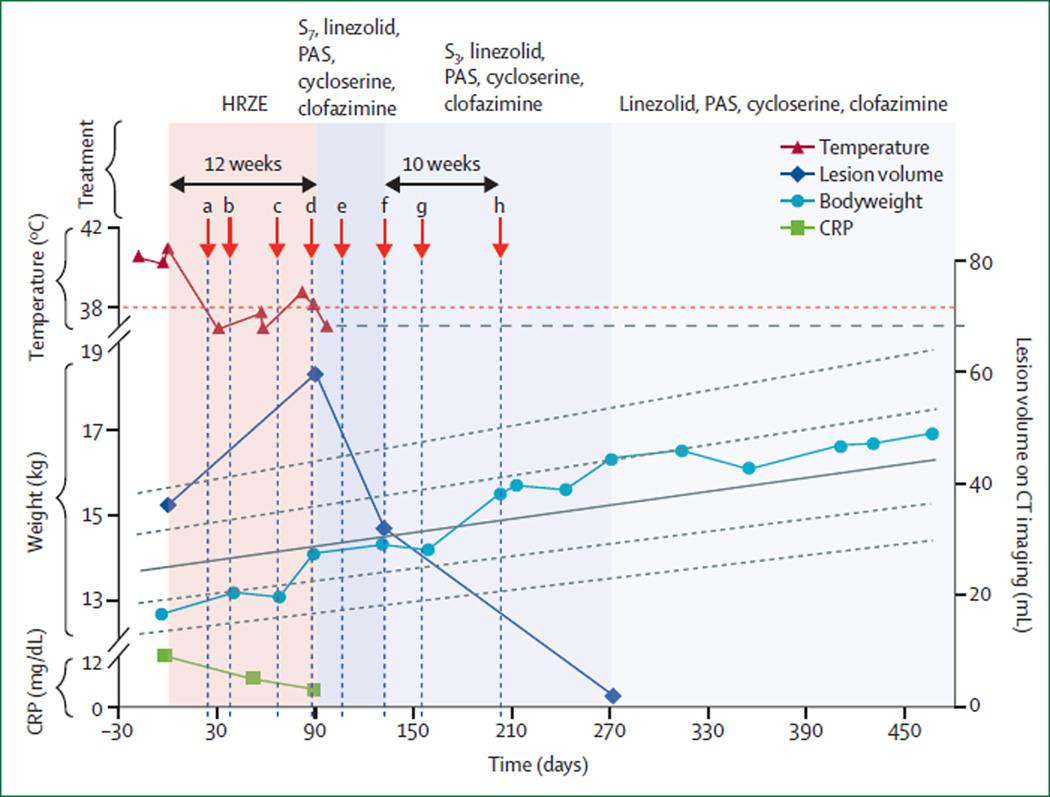
Figure 2. Clinical course.
The temperature, total bodyweight, lesion volume on CT imaging, and CRP concentration during the course of the illness and treatment are shown. The dashed red line shows the cutoff for fever; the child’s body temperature was not measured daily after it became normal, but she had a healthy body temperature thereafter (represented by the horizontal, dashed grey line). The solid grey line shows mean (0 Z score) female weight-for-age growth, and the dashed grey lines correspond to the 1, 0·5, −0·5, and −1 female weight-for-age Z scores. Red arrows denote: (a) growth of acid-fast bacilli in liquid broth; (b) identification of Mycobacterium tuberculosis complex by 16S rRNA sequencing; (c) persistent left lower lobe infiltrate on chest radiography; (d) Sanger sequencing and initial TREK panel confirming extensively drug-resistant strain; (e) agar proportion results (from the Maryland Department of Health and Mental Hygiene reference laboratory); (f) CT showing substantial reduction in lesion volume; (g) agar proportion results (from the National Jewish Health Mycobacteriology reference laboratory); (h) consistent weight gain. HRZE = isoniazid, rifampicin, pyrazinamide (discontinued at 8 weeks), and ethambutol. S7 = daily intravenous streptomycin. S3 = thrice-weekly intravenous streptomycin. PAS = para-aminosalicylic acid. CRP = C-reactive protein.

