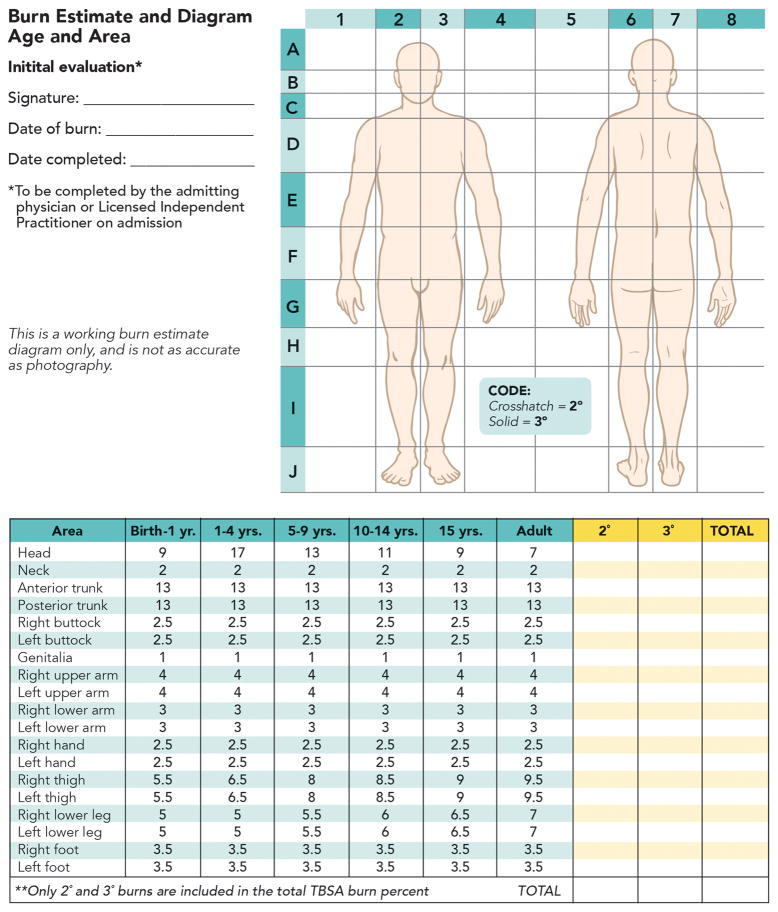
FIGURE 4. Lund-Browder burn diagram and table.
Lund-Browder burn diagram and table indicate the varying proportions in surface area in persons with different ages. A careful burn diagram should be completed at the time of initial evaluation including wound size, location, and estimated burn depth. Lund-Browder chart should be used in pediatric patients because the body surface area relationships vary with age. LIP = licensed independent practitioner; TBSA = total burn surface area.

