
Figure 2. Correlation of applanation tonometry (AT) vs Diaton tonometry (DT) IOP measurements for the keratoconus group (R2=0.104 P=0.006) and healthy controls (R2=0.017, P=0.316).
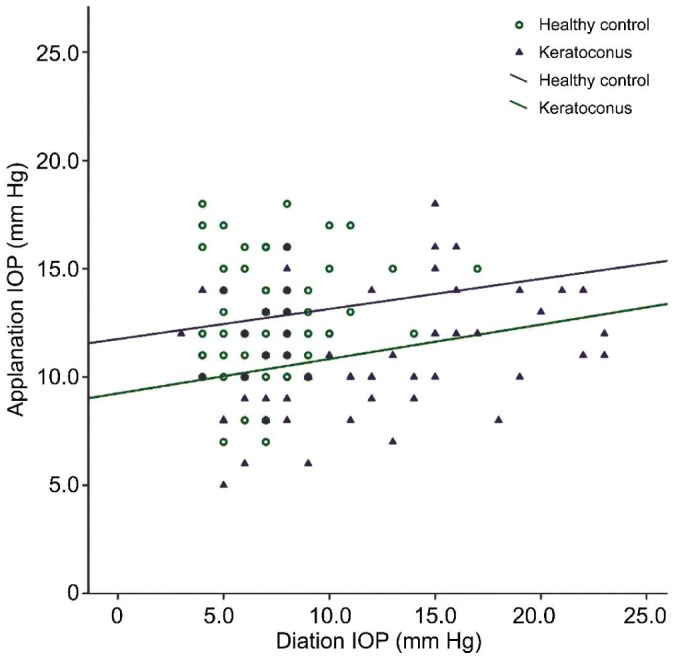
Trend lines are given for both groups.
Official websites use .gov
A
.gov website belongs to an official
government organization in the United States.
Secure .gov websites use HTTPS
A lock (
) or https:// means you've safely
connected to the .gov website. Share sensitive
information only on official, secure websites.
Trend lines are given for both groups.