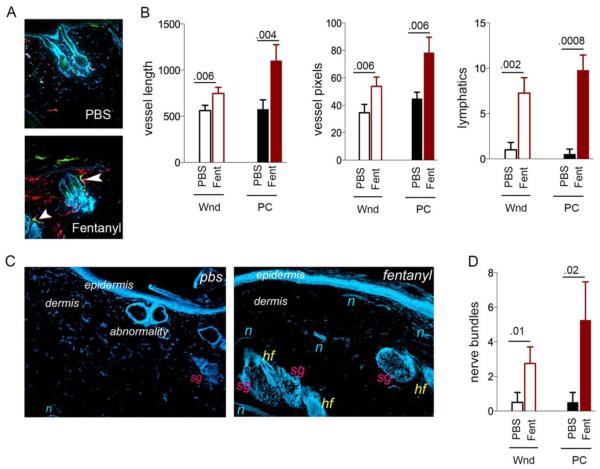
Figure 3. Vascular, lymphatic and nerve fiber modulation by topical fentanyl.
(A) Representative merged images of CD31-ir blood vessels (red), LYVE-1-ir lymphatics (green) and DAPI-stained nuclei (blue) in PBS or fentanyl treated wound scars post closure from ZDF rats. N=4 different rats/treatment. White arrows show lymphatics. Original magnification, x150. (B) Blood vessel pixels and length and number of lymphatics in each field of view of images in (A) are shown. Each bar shows the mean±SD from 4 separate experiments. P values are indicated above the bars. (C) Protein gene product 9.5-ir nerve fibers in the PBS or fentanyl treated wound scars post closure of wounds. Original magnification, x100. Each image represents 12 sections from 4 different animals per treatment. (D) Number of nerve bundles in each field of view shown in (C). Each bar shows the mean±SD from 4 separate experiments. P values are indicated above the bars. Abbreviations: Wnd, wound on day 20; PC, post closure on day 36; PBS, phosphate buffered saline; Fent, fentanyl; hf = hair follicle, sg = sebaceous gland, n = nerve fibers.

