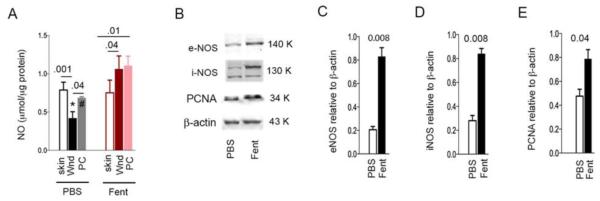
Figure 5. Fentanyl stimulates nitric oxide signaling and cellular proliferation.
(A) Intact skin removed to create wounds, wounds on day 20 and wound scars post-closure were analyzed for NO concentration. *p=0.002 Vs. fentanyl treated wound; #p=0.007 Vs. fentanyl treated post-closure scar. Other p values are indicated above the bars. Each bar shows the mean±SD from 4 separate experiments. (B) Representative images of 4 different Western blots of wound scars on day 20 analyzed for i- and e-NOS, PCNA and β-Actin. (C-E) Densitoimetric values of each protein band weighed against the respective β -Actin band of the Western blotting in (B) are shown. Each bar represents mean±SD from 4 different rat’s Western blots. P values are indicated above each set of bars. Abbreviations: NO, nitric oxide; PBS, phosphate buffered saline; Fent, fentanyl; Wnd, wound scar 20 days post-wounding; PC, wound scar post closure on day 36.

