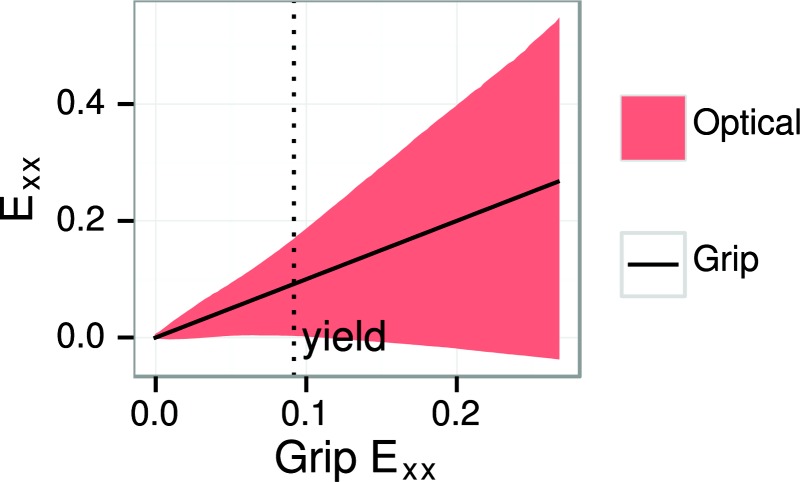
Fig. 13.

Optical longitudinal strain 0.05/0.95 interquartile range (shaded region) compared with grip strain (solid black line). The optical strain range broadens in proportion to the applied grip strain. This is a representative example; in other cases, the optical strain range may broaden nonlinearly. The plot shows data up to the peak point.
