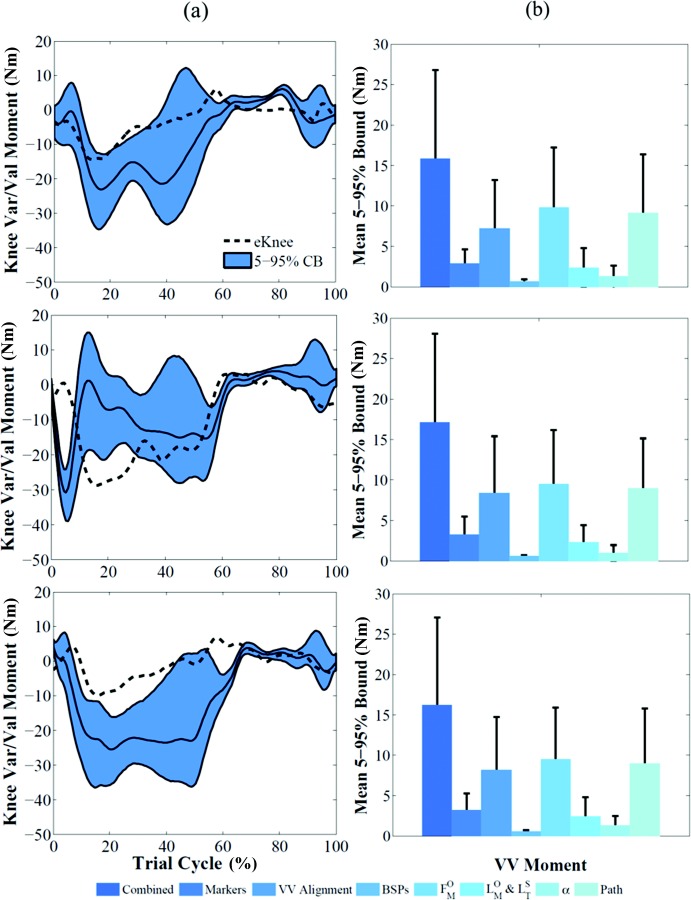
Fig. 6.

(a) Effect of all the uncertainties shown as 5–95% confidence bounds on varus/valgus contact moment for the three subjects. The baseline results are represented by the solid black line. Corresponding measured data are represented by the black dashed line. (b) Mean and standard deviation of 5–95% bounds for each individual source of uncertainty that affected contact moment for the three subjects.
