
Fig 1. Linkage disequilibrium (LD) plot in 1058 controls.
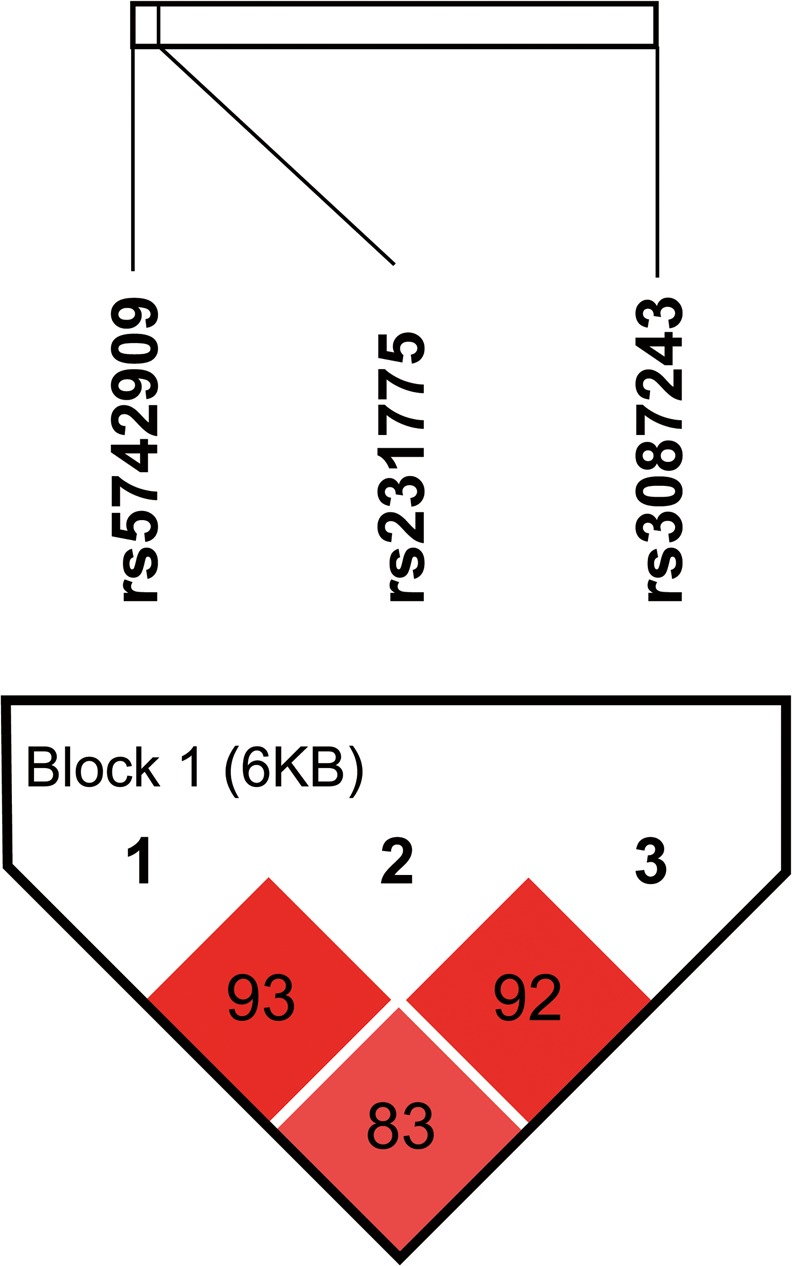
The ticks on the uppermost white bar denote the genotyped SNPs and their relative sites. The SNP pairwise information is plotted as boxes between these ticks. The number in the box denotes the D' value between each pair of SNPs. The intensity of the box color is proportional to the strength of the LD. The block is generated by solid spine of LD method in Haploview 4.2.