

Abstract
Osteoporosis is characterized by bony material loss and decreased bone strength leading to a significant increase in fracture risk. Patient-specific quantitative computed tomography (QCT) finite element (FE) models may be used to predict fracture under physiological loading. Material properties for the FE models used to predict fracture are obtained by converting grayscale values from the CT into volumetric bone mineral density (vBMD) using calibration phantoms. If there are any variations arising from the CT acquisition protocol, vBMD estimation and material property assignment could be affected, thus, affecting fracture risk prediction. We hypothesized that material property assignments may be dependent on scanning and postprocessing settings including voltage, current, and reconstruction kernel, thus potentially having an effect in fracture risk prediction. A rabbit femur and a standard calibration phantom were imaged by QCT using different protocols. Cortical and cancellous regions were segmented, their average Hounsfield unit (HU) values obtained and converted to vBMD. Estimated vBMD for the cortical and cancellous regions were affected by voltage and kernel but not by current. Our study demonstrated that there exists a significant variation in the estimated vBMD values obtained with different scanning acquisitions. In addition, the large noise differences observed utilizing different scanning parameters could have an important negative effect on small subregions containing fewer voxels.
Keywords: bone imaging, bone material properties, CT scanner variability, bone segmentation
Introduction
Osteoporosis, characterized by low bone mass and an increase in fracture risk, is a silent disease usually progressing for many years with few if any symptoms. Diagnosis is often made when a fracture has occurred, often leading to significant functional limitations [1,2]. This problem is rapidly increasing due to the aging population and affects millions of people leading to a significant economic burden. The gold standard for fracture risk assessment involves areal bone mineral density (aBMD) measured using dual-energy X-ray absorptiometry (DXA). However, while aBMD is considered a surrogate for bone strength, it is affected by the type of equipment, adjacent tissue density (fat, muscles, etc.), and patient size. Due to its low sensitivity and inability to capture 3D geometry and variation in bone density, aBMD obtained from DXA cannot solely be applied to assess fracture risk [3–5].
QCT has been considered an alternative to DXA for estimating BMD and prediction of fracture risk [6–11]. This technique can be combined with finite element analyses (QCT/FEA), and has been successfully used to assess fracture risk, failure strength, and stiffness of bones [12–14]. These models predict more accurately the failure characteristics of bones as they can assess geometry and vBMD distributions. Material properties for the models are obtained by converting grayscale (HU) values from the QCT images into vBMD using a calibration phantom. These vBMD values from each voxel of the QCT scan are then used to calculate a Young's modulus based on empirical equations published in the literature [12,15–20] to be assigned to each FE. However, any variability arising from the QCT acquisition protocol may affect the material property assignment, resulting in an imprecise fracture risk prediction. Dragomir-Daescu et al. demonstrated that QCT/FEA predicted strength and stiffness vary between models developed from high- and low-resolution scans [21]. With more scientists utilizing QCT in fracture risk assessment and FE modeling in osteoporosis related research, the effect of several common scanning parameters and postprocessing settings on vBMD estimates should be further studied.
The purpose of this study was to test the effect of scanning parameters and postprocessing settings on estimated vBMD from scans. We hypothesized that these factors will impact vBMD estimates from QCT and need to be accounted for in future research and clinical efforts in the field of FE modeling, osteoporosis, and fracture risk prediction.
Materials and Methods
QCT Scanning.
A rabbit femur was obtained from another study after approval by our institutional review board. The femur was cleaned of surrounding soft tissue using a scalpel, wrapped in a tissue soaked with saline, and stored at −20 °C until further use. The bone and a calibration phantom (Mindways, Inc., Austin, TX) containing five rods of reference materials, calibrated against liquid K2HPO4/water solutions were scanned in air using a Somatom Definition Dual-Source Scanner (Siemens, Germany). All scans were performed during one session without moving the femur from the scanner table. Scanning acquisitions were obtained at a detector collimation of 128 × 0.6 mm, pitch 0.8 mm helical scan using different settings and postprocessing parameters according to Table 1. The femur was scanned six times varying voltage and current, and reconstructed to obtain a total of 12 sets of images based on the combinations of voltage, current, and reconstruction kernels described in Table 1. These values were chosen to represent a wide range of parameters commonly used both in the clinic and QCT/FEA research. A hard (B70) and a soft (B30) kernel were selected for image reconstruction. A hard kernel is usually used to increase spatial resolution improving segmentation accuracy, while a soft kernel is commonly used in the clinic. Figure 1 shows two sample digital imaging and communications in medicine (DICOM) images obtained from the CT scanner using two different acquisition protocols.
Table 1.
Summary of scanning settings and postprocessing parameters
| Scanning | Postprocessing | ||
|---|---|---|---|
| Voltage (kVp) | Current (mAs) | Reconstruction kernel | Slice thickness |
| 80, 120, 140 | 110, 450 | B30, B70 | 0.6 |
Fig. 1.
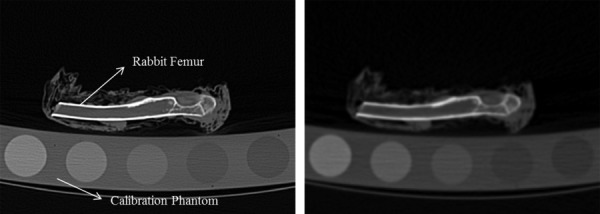
Computed tomography images showing the calibration phantom and the femur using two different acquisition protocols. (a) B70 kernel, 0.6 mm isotropic slice thickness, 450 mAs, and 140 kVp. (b) B30 kernel, 0.6 mm isotropic slice thickness, 110 mAs, and 80 kVp.
Image Analysis.
QCT–DICOM images were uploaded into Mimics image processing and editing software (Materialise US, Ann Arbor, MI). The highest scan resolution (140 kVp, 450 mAs, 0.6 mm isotropic voxel and B70 reconstruction kernel) was used to create the segmentations and outlines of the cortical and cancellous bone, and for the reference rods of the phantom. A semi-automatic segmentation process was performed by a single operator by initially applying a standard HU window (HU > 225) to define the cortical bone region. A region growing operation allowed the cortex to be separated from pixels inside and outside the femur cortical region that had similar HU intensity values but were not part of the cortex. Each slice was then manually edited to include the entire cortical region and to exclude the soft tissue at the surface of the femur. Briefly, by applying editing tools, regions of the cortex that were not included in the initial cortical mask were incorporated to make a closed polyline perimeter, and regions that did not belong to the cortex were manually deleted. Polylines were created from the segmented cortex and the enclosed region, including cortical and cancellous bone, was masked. The cancellous bone region was then obtained by performing Boolean operations and subtracting the cortical region from the original segmentation. Top and bottom axial slices, representing the images containing the entire femur were located for segmenting of the five calibration rods. A region of interest (ROI) was placed within the reference area, centered, and distant from the edges to minimize partial volume errors, and the volume region contained between the top and bottom slices was segmented. Mean CT number values (HU), from all segmentations, were obtained for the five calibration rods, and for the cortical and cancellous regions of the rabbit femur. These masks were then imported into the scans obtained at different settings and the respective mean HU numbers exported in text-based format. Figure 2 shows the masks of the rods and bone, and a three-dimensional representation of these structures.
Fig. 2.
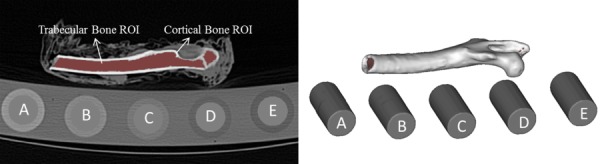
Segmented image showing the masked femur and a three-dimensional representation of the cancellous and cortical volumetric regions. Individual rods from the calibration phantom are also shown.
Bone Mineral Density Estimation.
Mean HU values from the calibration phantom containing reference material were used to obtain equivalent K2HPO4 densities (vBMD) from the HU data of the unknown cortical and trabecular volumetric regions using a custom linear regression program in matlab (Mathworks, Natick, MA). Based on the manufacture's user guidelines, the following relationship was considered:
| (1) |
where is the CT number within a ROI in a reference or unknown material (in HU), is the K2HPO4 equivalent density of material within the measured ROI, is the water equivalent density of material within the measured ROI, is the imaging technique-specific parameter defining the response of the CT scanner to K2HPO4, is the imaging technique-specific parameter characteristic of the CT number scale and
| (2) |
| (3) |
Finally, the unknown equivalent K2HPO4 density was obtained using
| (4) |
The estimation of (slope) and (y-intercept), from the HU measurements () of the five rods in the calibration phantom, was reduced to a linear estimation problem that was handled by standard linear regression techniques using Eq. (1). Once these parameters were determined, the corresponding values for and were obtained using Eqs. (2) and (3). The slope of the line characterizes the response of the CT scanner to changes in pure K2HPO4 density only. However, the reference standard is an aqueous solution of K2HPO4 at different concentrations. The offset of 0.2174 compensates for the amount of water displaced when adding K2HPO4. On the other hand, 999.6 is added to the intercept value to represent the density of water at room temperature. For each scan setting acquisition, the unknown vBMD values () from the cortical and cancellous regions were obtained with Eq. (4) as the calculated equivalent K2HPO4 densities. The regression equation for each image data was extrapolated to cover the entire range of cancellous and cortical bone (Fig. 3).
Fig. 3.
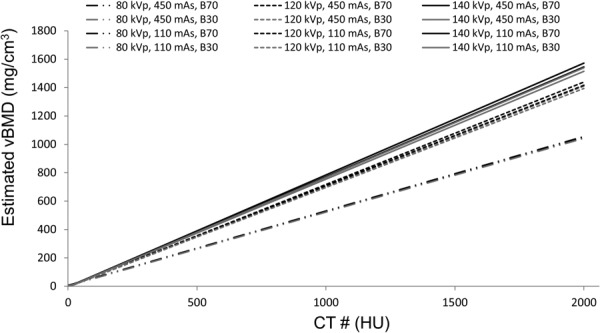
Sample regression curves used for vBMD estimation obtained from the different QCT scanning acquisitions
Statistical Analysis.
Summary statistics for HU and estimated vBMD were calculated for cortical and cancellous bone. Both outcomes were analyzed separately using analysis of variance (ANOVA) to determine whether or not the average measurements differed between levels of the main effects, assuming interactions were negligible. Because the objective was to assess differences in measurement on the same bone, image data were assumed to be independent (as opposed to subjects). Effect sizes eta squared was also calculated.
Results
Table 2 summarizes the HU measurements (mean and SD) obtained on each rod of the calibration phantom and on the cortical and cancellous regions of the rabbit femur for the different scanning acquisitions and postprocessing parameters. Regression parameters for each image data obtained from the calibration phantom as well as the estimated vBMD values of the cortical and cancellous bone regions are shown in Table 3. Figure 3 shows the variability in estimated vBMD values based on the regression parameters obtained using the different acquisition settings.
Table 2.
HU values for the calibration phantom and femur regions
|
Calibration phantom rods |
||||||||||
|---|---|---|---|---|---|---|---|---|---|---|
| Voltage (kVp) | Current (mAs) | Slice thickness | Reconstruction kernel | A | B | C | D | E | Cortical bone | Cancellous bone |
| 80 | 110 | 0.6 | B30 | 716 (29) | 458 (29) | 237 (28) | −65 (27) | −112 (26) | 1080 (439) | 258 (319) |
| B70 | 712 (198) | 450 (207) | 231 (187) | −66 (192) | −112 (183) | 1340 (824) | 81 (335) | |||
| 450 | 0.6 | B30 | 715 (20) | 452 (18) | 229 (17) | −70 (16) | −114 (17) | 1093 (415) | 253 (304) | |
| B70 | 707 (105) | 442 (110) | 222 (100) | −70 (102) | −114 (98) | 1380 (732) | 63 (280) | |||
| 120 | 110 | 0.6 | B30 | 539 (17) | 388 (17) | 211 (16) | −34 (16) | −78 (16) | 845 (319) | 171 (219) |
| B70 | 530 (110) | 379 (113) | 205 (104) | −34 (106) | −79 (98) | 1096 (585) | 8 (204) | |||
| 450 | 0.6 | B30 | 537 (14) | 391 (11) | 219 (11) | −26 (10) | −71 (12) | 844 (314) | 174 (217) | |
| B70 | 526 (57) | 383 (57) | 214 (54) | −26 (55) | −72 (53) | 1092 (567) | 14 (196) | |||
| 140 | 110 | 0.6 | B30 | 494 (16) | 369 (14) | 208 (13) | −21 (14) | −64 (15) | 780 (293) | 156 (200) |
| B70 | 482 (90) | 360 (95) | 203 (88) | −21 (90) | −65 (88) | 1012 (531) | 6 (184) | |||
| 450 | 0.6 | B30 | 499 (12) | 376 (10) | 209 (9) | −23 (9) | −68 (12) | 777 (288) | 159 (200) | |
| B70 | 488 (48) | 368 (49) | 205 (47) | −24 (46) | −68 (44) | 1004 (507) | 11 (177) | |||
Note: Mean (SD) are given in HU.
Table 3.
Summary of results. Regression parameters obtained using the calibration phantom were used to estimate cortical and cancellous vBMD from measured HU values.
|
Regression parameters |
Estimated bone mineral density |
||||||
|---|---|---|---|---|---|---|---|
| Voltage (kVp) | Current (mAs) | Slice thickness | Reconstruction kernel | Slope (σCT) | y intercept (βCT) | Cortical bone (vBMD) | Cancellous bone (vBMD) |
| 80 | 110 | 0.6 | B30 | 1.9213 | −4.9 | 565 | 137 |
| B70 | 1.9118 | −8.0 | 705 | 47 | |||
| 450 | 0.6 | B30 | 1.9270 | −9.7 | 572 | 137 | |
| B70 | 1.9067 | −12.9 | 729 | 40 | |||
| 120 | 110 | 0.6 | B30 | 1.4335 | 1.4 | 589 | 118 |
| B70 | 1.4129 | −1.8 | 777 | 7 | |||
| 450 | 0.6 | B30 | 1.4116 | 8.0 | 592 | 117 | |
| B70 | 1.3857 | 5.2 | 784 | 6 | |||
| 140 | 110 | 0.6 | B30 | 1.2947 | 6.5 | 597 | 116 |
| B70 | 1.2693 | 3.8 | 794 | 2 | |||
| 450 | 0.6 | B30 | 1.3161 | 6.0 | 588 | 116 | |
| B70 | 1.2913 | 3.4 | 775 | 6 | |||
Note: vBMD: volumetric Bone mineral density (mg/cm3).
Summary statistics are presented in Table 4. ANOVA on the main effects found average HU, in both cortical and cancellous bone regions, to differ between levels of voltage and kernel (P < 0.0001) but not current (P = 0.8299 and P = 0.8241, respectively). However, estimated vBMD in both bone regions was mostly affected by kernel (P < 0.0001). Effect sizes (η2) showed the reconstruction kernel to account for much of the variation in cancellous HU (η2 = 0.5991) values as well as in cancellous and cortical estimated vBMD values (η2 = 0.6830 and η2 = 0.5826, respectively). Voltage was also the additional scanning factor influencing cortical HU outcome measurements (η2 = 0.5046). Current accounted for very little variation and showed no significant influence in both HU measured and vBMD estimated values. Using a hard kernel (B70), higher HU and vBMD values were obtained for the cortical bone when compared to a soft kernel (B30) (Tables 3 and 4). The opposite was observed for cancellous bone, presenting lower HU and vBMD values for a hard versus a soft kernel. The largest differences in cortical and cancellous estimated vBMD due to the hard and soft kernels were observed when using high voltage (140 kVp) and low current (110 mAs).
Table 4.
Summary statistics for measured cortical and cancellous HU and estimated vBMD
|
Cortical HU |
Cancellous HU |
|||
|---|---|---|---|---|
| p-value | η2 | p-value | η2 | |
| Voltage (kVp) | <0.0001 | 0.5046 | <0.0001 | 0.1835 |
| Current (mAs) | 0.8299 | 0.0003 | 0.8241 | 0.0004 |
| Reconstruction kernel | <0.0001 | 0.2855 | <0.0001 | 0.5991 |
| Estimated cortical vBMD | Estimated cancellous vBMD | |||
|---|---|---|---|---|
| p-value | η2 | p-value | η2 | |
| Voltage (kVp) | 0.4770 | 0.0194 | 0.1070 | 0.0425 |
| Current (mAs) | 0.7256 | 0.0016 | 0.8118 | 0.0005 |
| Reconstruction kernel | <0.0001 | 0.5826 | <0.0001 | 0.6830 |
Discussion
The goal of this study was to assess the effect of scanning acquisition settings (kVp and mAs) and postprocessing parameters (reconstruction kernels) on estimated bone mineral density from QCT images. We hypothesized that material property assignments for specimen-specific FE models obtained using a calibration phantom may be dependent on scanning and postprocessing acquisition settings, thus, having an effect in fracture risk prediction. For these purposes, a rabbit femur was obtained and imaged using QCT with different protocols. Cortical and cancellous regions were segmented using the highest scan resolution available to create a segmentation which was imported into the remaining scans. Cortical and cancellous region HU values were obtained, and a standard calibration phantom was used to convert these HU values to vBMD.
The results of this investigation demonstrated that average estimated vBMD for the cortical and cancellous regions were affected by voltage, but more importantly by the reconstruction kernel, while current did not have a significant effect. When observing individual settings, we found that cortical HU values were mostly affected by voltage, followed by kernel. On the other hand, reconstruction kernel affected the cancellous HU values the most, followed by tube voltage. Although it is expected for HU values to be affected by scanners and manufacturers [22], or by the scanning and postprocessing parameters, it is not encouraging to observe that cortical and cancellous vBMD values cannot be consistently estimated when following the specifications and guidelines of a calibration phantom and using a scan-specific conversion equation. While exposure, defined by current, had no effect in the estimated values for both cortical and cancellous regions, interestingly, effect sizes (η2) showed the reconstruction kernel to produce the largest variation in cortical and cancellous estimated vBMD values. Fortunately, the calibration phantom partially corrected for voltage changes as demonstrated by the corresponding effect size being smaller in calibrated vBMD values compared to raw HU values for both cortical and cancellous regions.
Many studies have been performed on vertebra, femora, and other bones using QCT/FEA [3,12,14,17,23–28]. Gray values of the CT images were converted to vBMD using a calibration phantom to develop patient specific models and assign material properties to the bone. These material assignments are based on equations obtained from the literature which correlate vBMD to Young's modulus. However, several studies did not include a complete description of the scanning parameters used in their CT image acquisition, or if these settings differed between specimens or from other institutions. As this study demonstrates, the correlation between HU values and thereby estimated vBMD using a phantom will depend on the acquisition parameters. A previous study by Dragomir-Daescu et al. showed predicted strength and stiffness of QCT/FEA models to differ between a high- and a low-resolution scanning protocol [21]. Although the study differentiated the predictive outcomes based on these two scanning protocols which combined voltage, current, and kernel, it did not consider the individual effects of these variables. The variations in measured HU values and estimated vBMD using phantoms could thus lead to incorrect estimations of bone strength and stiffness from FE models, as demonstrated in their study [21].
Several features introduce uncertainties when developing a CT-based FE model and assigning material properties to the elements. The cancellous region of bone often contains bone mineral, bone matrix, red bone marrow, and yellow (fatty) bone marrow [9]. These different components will affect the estimated cancellous vBMD distribution obtained from the measured HU values, possibly leading to variations in results. In order to overcome this problem, dual-energy CT should be used to isolate and measure individual tissues. The cancellous bone density values could also be affected by unintentionally including voxels in the close proximity of the outer cortical boundary during the segmentation process. For FE modeling, red and yellow bone marrows from specimens are usually not removed. Furthermore, cortical and cancellous bone are both included for the purpose of developing patient-specific models, and these are assigned discrete material properties based on the average density of each voxel.
As previously stated, kernels had a significant effect on cortical and cancellous estimated vBMD. The reconstruction kernel is the filter applied to the raw data to yield a final image. As shown in Fig. 1, a soft kernel (B30) smoothed the edges and reduced the image noise, while a hard kernel (B70) enhanced the edges of the bone but increased the image noise. The letter “B” stands for a “body kernel,” while the image sharpness is represented by the number in the kernel type; the higher the number the shaper the image [29]. Reconstruction kernels affect HU values due to an overshoot/undershoot problem, driving cortical values up and cancellous values down. The hard kernel sharpens edges by enhancing high spatial frequencies, leading to an overshoot near the edges of bright objects, and a consequent undershoot in adjacent darker areas. This is visually and numerically similar to the effect of beam hardening, particularly for subregions within the cortex with lower HU values. A smaller effect would probably be observed in the absence of a cortex as the combination of overshoot and undershoot within cancellous tissue would to some extent balance out on the average. The edge sharpening of the hard kernel could be potentially completely undone by blurring the reconstructed CT image reproducing an image similar to the softer kernel. However, this will lead to some image degradation due to the grayscale resolution of the reconstructed QCT image and thus it would be preferable to rather use the softer kernel during reconstruction. The calibration phantom is supposed to correct for current and voltage effects. Although phantom manufacturing tolerance and the assumption of a linear correction make it suboptimal, the estimated vBMD numbers are much less affected by voltage than the HU numbers. However, the calibration phantom will not be effective in correcting reconstruction kernel effects. The calibration procedure assumes linear effects on the entire field regardless of material densities, and the kernel causes effects related to the existence of edges between high- and low-density materials. A new calibration phantom made of rods with a high-density shell around each reference material would possibly allow for kernel choice correction, but that would lead to a more complicated approach than a linear correction. A standardization of reconstruction kernels might make generic kernel corrections possible without a specialized calibration phantom.
This study has several limitations. First, individual or smaller groups of voxels, not cortical and cancellous regions as described in the current study, are usually assigned a density based on their grayscale values. Although the results presented in this study combine all voxels into a single cancellous and a single cortical region, it shows the disparity in values that can be associated with a variation in acquisition and reconstruction protocol settings. Furthermore, the large differences in standard deviation values (noise) between scans could have an even larger negative effect when estimating vBMD on small subregions containing fewer voxels compared to the characterization of larger regions. Second, only one scanner was used in this study, preventing the analysis of variability between manufactures and scanner models. Finally, the effect of voxel size was not evaluated as the slice thickness was kept constant at 0.6 mm, and a single segmentation process was obtained from the highest scan resolution and used for all successive scan images. Varying the voxel size would have prevented the current approach and would have led to different masks and number of voxels between different scan resolutions, thus introducing additional variables. Future studies should look into implementing an FE mesh template that is independent of voxel size to assess the effect of individual parameters on bone material properties estimation.
In conclusion, this study showed that vBMD estimations varied with scanning and postprocessing parameters. Although the calibration phantom was able to correct for voltage when converting HU values to vBMD values, it was unable to calibrate for kernel differences. These results indicate that it is necessary to standardize acquisition protocols so that material property assignments can be independent of the scanner settings and postprocessing variables chosen and that a more robust method should be found to account for the different choices in QCT parameters in the clinic.
Acknowledgment
This work was supported by the Mayo Foundation, the Scoliosis Research Society (SRS) and the Orthopedic Research and Education Foundation (OREF). The authors would like to acknowledge the National Institute of Arthritis And Musculoskeletal And Skin Diseases for the Musculoskeletal Research Training Program (T32-AR56950), and the Opus CT Imaging Resource of Mayo Clinic (NIH Construction Grant No. RR018898) for CT imaging of the femur. The authors declare that they have no conflict of interest.
Contributor Information
Hugo Giambini, Biomechanics Laboratory, , Division of Orthopedic Research, , Mayo Clinic, , Rochester, MN 55905 , e-mail: giambini.hugo@mayo.edu.
Dan Dragomir-Daescu, Division of Engineering, , Mayo Clinic College of Medicine, , Mayo Clinic, , Rochester, MN 55905 , e-mail: dragomirdaescu.dan@mayo.edu.
Paul M. Huddleston, Biomechanics Laboratory, , Division of Orthopedic Research, , Department of Orthopedic Surgery, , Mayo Clinic, , Rochester, MN 55905 , e-mail: huddleston.paul@mayo.edu
Jon J. Camp, Biomedical Imaging Resource, , Department of Radiology, , Mayo Clinic College of Medicine, , Rochester, MN 55905 , e-mail: camp.jon@mayo.edu
Kai-Nan An, Biomechanics Laboratory, , Division of Orthopedic Research, , Mayo Clinic, , Rochester, MN 55905 , e-mail: an.kainan@mayo.edu.
Ahmad Nassr, Biomechanics Laboratory, , Division of Orthopedic Research, , Department of Orthopedic Surgery, , Mayo Clinic, , Rochester, MN 55905 , e-mail: nassr.ahmad@mayo.edu.
References
- [1]. Kayanja, M. M. , Ferrara, L. A. , and Lieberman, I. H. , 2004, “ Distribution of Anterior Cortical Shear Strain after a Thoracic Wedge Compression Fracture,” Spine J., 4(1), pp. 76–87. 10.1016/j.spinee.2003.07.003 [DOI] [PubMed] [Google Scholar]
- [2]. Melton, L. J., III , and Kallmes, D. F. , 2006, “ Epidemiology of Vertebral Fractures: Implications for Vertebral Augmentation,” Acad. Radiol., 13(5), pp. 538–545. 10.1016/j.acra.2006.01.005 [DOI] [PubMed] [Google Scholar]
- [3]. Homminga, J. , Weinans, H. , Gowin, W. , Felsenberg, D. , and Huiskes, R. , 2001, “ Osteoporosis Changes the Amount of Vertebral Trabecular Bone at Risk of Fracture But Not the Vertebral Load Distribution,” Spine, 26(14), pp. 1555–1561. 10.1097/00007632-200107150-00010 [DOI] [PubMed] [Google Scholar]
- [4]. Imai, K. , Ohnishi, I. , Matsumoto, T. , Yamamoto, S. , and Nakamura, K. , 2009, “ Assessment of Vertebral Fracture Risk and Therapeutic Effects of Alendronate in Postmenopausal Women Using a Quantitative Computed Tomography-Based Nonlinear Finite Element Method,” Osteoporosis Int., 20(5), pp. 801–810. 10.1007/s00198-008-0750-8 [DOI] [PubMed] [Google Scholar]
- [5]. McDonnell, P. , McHugh, P. E. , and O'Mahoney, D. , 2007, “ Vertebral Osteoporosis and Trabecular Bone Quality,” Ann. Biomed. Eng., 35(2), pp. 170–189. 10.1007/s10439-006-9239-9 [DOI] [PubMed] [Google Scholar]
- [6]. Cann, C. E. , Genant, H. K. , Kolb, F. O. , and Ettinger, B. , 1985, “ Quantitative Computed Tomography for Prediction of Vertebral Fracture Risk,” Bone, 6(1), pp. 1–7. 10.1016/8756-3282(85)90399-0 [DOI] [PubMed] [Google Scholar]
- [7]. Genant, H. K. , Ettinger, B. , Cann, C. E. , Reiser, U. , Gordan, G. S. , and Kolb, F. O. , 1985, “ Osteoporosis: Assessment by Quantitative Computed Tomography,” Orthop. Clin. N. Am., 16(3), pp. 557–568. [PubMed] [Google Scholar]
- [8]. Cann, C. E. , 1987, “ Quantitative CT Applications: Comparison of Current Scanners,” Radiology, 162(1 Pt 1), pp. 257–261. 10.1148/radiology.162.1.3786773 [DOI] [PubMed] [Google Scholar]
- [9]. Cann, C. E. , 1988, “ Quantitative CT for Determination of Bone Mineral Density: A Review,” Radiology, 166(2), pp. 509–522. 10.1148/radiology.166.2.3275985 [DOI] [PubMed] [Google Scholar]
- [10]. Biggemann, M. , Hilweg, D. , Seidel, S. , Horst, M. , and Brinckmann, P. , 1991, “ Risk of Vertebral Insufficiency Fractures in Relation to Compressive Strength Predicted by Quantitative Computed Tomography,” Eur. J. Radiol., 13(1), pp. 6–10. 10.1016/0720-048X(91)90047-Y [DOI] [PubMed] [Google Scholar]
- [11]. Lang, T. F. , Li, J. , Harris, S. T. , and Genant, H. K. , 1999, “ Assessment of Vertebral Bone Mineral Density Using Volumetric Quantitative CT,” J. Comput. Assisted Tomogr., 23(1), pp. 130–137. 10.1097/00004728-199901000-00027 [DOI] [PubMed] [Google Scholar]
- [12]. Dragomir-Daescu, D. , Op Den Buijs, J. , Mceligot, S. , Dai, Y. , Entwistle, R. C. , Salas, C. , Melton, L. J., III , Bennet, K. E. , Khosla, S. , and Amin, S. , 2011, “ Robust QCT/FEA Models of Proximal Femur Stiffness and Fracture Load During a Sideways Fall on the Hip,” Ann. Biomed. Eng., 39(2), pp. 742–755. 10.1007/s10439-010-0196-y [DOI] [PMC free article] [PubMed] [Google Scholar]
- [13]. Homminga, J. , Van-Rietbergen, B. , Lochmuller, E. M. , Weinans, H. , Eckstein, F. , and Huiskes, R. , 2004, “ The Osteoporotic Vertebral Structure is Well Adapted to the Loads of Daily Life, But Not to Infrequent ‘Error’ Loads,” Bone, 34(3), pp. 510–516. 10.1016/j.bone.2003.12.001 [DOI] [PubMed] [Google Scholar]
- [14]. Imai, K. , Ohnishi, I. , Bessho, M. , and Nakamura, K. , 2006, “ Nonlinear Finite Element Model Predicts Vertebral Bone Strength and Fracture Site,” Spine, 31(16), pp. 1789–1794. 10.1097/01.brs.0000225993.57349.df [DOI] [PubMed] [Google Scholar]
- [15]. Snyder, S. M. , and Schneider, E. , 1991, “ Estimation of Mechanical Properties of Cortical Bone by Computed Tomography,” J. Orthop. Res., 9(3), pp. 422–431. 10.1002/jor.1100090315 [DOI] [PubMed] [Google Scholar]
- [16]. Kato, N. , Koshino, T. , Saito, T. , and Takeuchi, R. , 1998, “ Estimation of Young's Modulus in Swine Cortical Bone Using Quantitative Computed Tomography,” Bull. Hosp. Jt. Dis., 57(4), pp. 183–186. [PubMed] [Google Scholar]
- [17]. Anderson, D. E. , Demissie, S. , Allaire, B. T. , Bruno, A. G. , Kopperdahl, D. L. , Keaveny, T. M. , Kiel, D. P. , and Bouxsein, M. L. , 2014, “ The Associations Between QCT-Based Vertebral Bone Measurements and Prevalent Vertebral Fractures Depend on the Spinal Locations of Both Bone Measurement and Fracture,” Osteoporosis Int., 25(2), pp. 559–566. 10.1007/s00198-013-2452-0 [DOI] [PMC free article] [PubMed] [Google Scholar]
- [18]. Morgan, E. F. , Bayraktar, H. H. , and Keaveny, T. M. , 2003, “ Trabecular Bone Modulus-Density Relationships Depend on Anatomic Site,” J. Biomech., 36(7), pp. 897–904. 10.1016/S0021-9290(03)00071-X [DOI] [PubMed] [Google Scholar]
- [19]. Keller, T. S. , 1994, “ Predicting the Compressive Mechanical Behavior of Bone,” J. Biomech., 27(9), pp. 1159–1168. 10.1016/0021-9290(94)90056-6 [DOI] [PubMed] [Google Scholar]
- [20]. Kopperdahl, D. L. , Morgan, E. F. , and Keaveny, T. M. , 2002, “ Quantitative Computed Tomography Estimates of the Mechanical Properties of Human Vertebral Trabecular Bone,” J. Orthop. Res., 20(4), pp. 801–805. 10.1016/S0736-0266(01)00185-1 [DOI] [PubMed] [Google Scholar]
- [21]. Dragomir-Daescu, D. , Salas, C. , Uthamaraj, S. , and Rossman, T. , 2015, “ Quantitative Computed Tomography-Based Finite Element Analysis Predictions of Femoral Strength and Stiffness Depend on Computed Tomography Settings,” J. Biomech., 48(1), pp. 153–161. 10.1016/j.jbiomech.2014.09.016 [DOI] [PMC free article] [PubMed] [Google Scholar]
- [22]. Levi, C. , Gray, J. E. , McCullough, E. C. , and Hattery, R. R. , 1982, “ The Unreliability of CT Numbers as Absolute Values,” Am. J. Roentgenol., 139(3), pp. 443–447. 10.2214/ajr.139.3.443 [DOI] [PubMed] [Google Scholar]
- [23]. Bessho, M. , Ohnishi, I. , Matsuyama, J. , Matsumoto, T. , Imai, K. , and Nakamura, K. , 2007, “ Prediction of Strength and Strain of the Proximal Femur by a CT-Based Finite Element Method,” J. Biomech., 40(8), pp. 1745–1753. 10.1016/j.jbiomech.2006.08.003 [DOI] [PubMed] [Google Scholar]
- [24]. Buckley, J. M. , Cheng, L. , Loo, K. , Slyfield, C. , and Xu, Z. , 2007, “ Quantitative Computed Tomography-Based Predictions of Vertebral Strength in Anterior Bending,” Spine, 32(9), pp. 1019–1027. 10.1097/01.brs.0000260979.98101.9c [DOI] [PubMed] [Google Scholar]
- [25]. Matsumoto, T. , Ohnishi, I. , Bessho, M. , Imai, K. , Ohashi, S. , and Nakamura, K. , 2009, “ Prediction of Vertebral Strength Under Loading Conditions Occurring in Activities of Daily Living Using a Computed Tomography-Based Nonlinear Finite Element Method,” Spine, 34(14), pp. 1464–1469. 10.1097/BRS.0b013e3181a55636 [DOI] [PubMed] [Google Scholar]
- [26]. Mirzaei, M. , Keshavarzian, M. , and Naeini, V. , 2014, “ Analysis of Strength and Failure Pattern of Human Proximal Femur Using Quantitative Computed Tomography (QCT)-Based Finite Element Method,” Bone, 64, pp. 108–114. 10.1016/j.bone.2014.04.007 [DOI] [PubMed] [Google Scholar]
- [27]. Mirzaei, M. , Zeinali, A. , Razmjoo, A. , and Nazemi, M. , 2009, “ On Prediction of the Strength Levels and Failure Patterns of Human Vertebrae Using Quantitative Computed Tomography (QCT)-Based Finite Element Method,” J. Biomech., 42(11), pp. 1584–1591. 10.1016/j.jbiomech.2009.04.042 [DOI] [PubMed] [Google Scholar]
- [28]. Wang, X. , Sanyal, A. , Cawthon, P. M. , Palermo, L. , Jekir, M. , Christensen, J. , Ensrud, K. E. , Cummings, S. R. , Orwoll, E. , Black, D. M. , and Keaveny, T. M. , 2012, “ Prediction of New Clinical Vertebral Fractures in Elderly Men Using Finite Element Analysis of CT Scans,” J. Bone Miner. Res., 27(4), pp. 808–816. 10.1002/jbmr.1539 [DOI] [PMC free article] [PubMed] [Google Scholar]
- [29]. Jang, K. , Kweon, D. , Lee, J. , Choi, J. , Goo, E. , Dong, K. , Lee, J. , Jin, G. , and Seo, S. , 2011, “ Measurement of Image Quality in CT Images Reconstructed With Different Kernels,” J. Korean Phys. Soc., 58(2), pp. 334–342. 10.3938/jkps.58.334 [DOI] [Google Scholar]