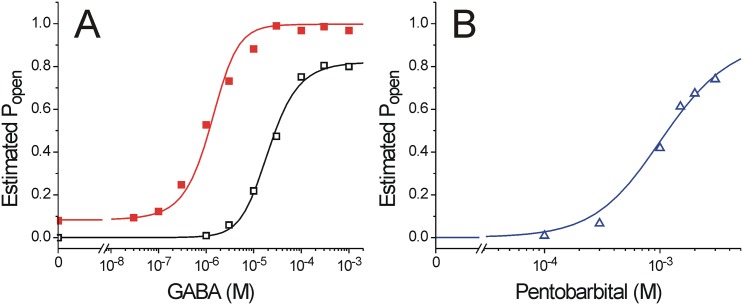
Fig 5. A Monod-Wyman-Changeux co-agonist model for PB activation and GABA modulation in α1β3γ2L GABAA receptors.
Estimated Popen values were generated from average data in Figs 1B and 4C and fitted with a function describing MWC co-agonism with two equivalent GABA sites and n equivalent PB sites (Eq 2 in Methods). Fitted values were: L0 = 1100 ± 460; KG = 33.6 ± 6.2 μM; c = 0.014 ± 0.0035; KPB = 5.3 ± 8.6 mM; d = 0.0026 ± 0.0061; n = 1.7 ± 0.45. A) Estimated Popen values derived from Fig 1B are shown (open symbols are responses to GABA alone and solid symbols are GABA supplemented with 236 μM PB). Lines through data represent the fitted MWC model. B) Estimated Popen values derived from Fig 4C (corrected PB activation responses) are plotted as open triangles. The line through data points represents the fitted MWC model.

