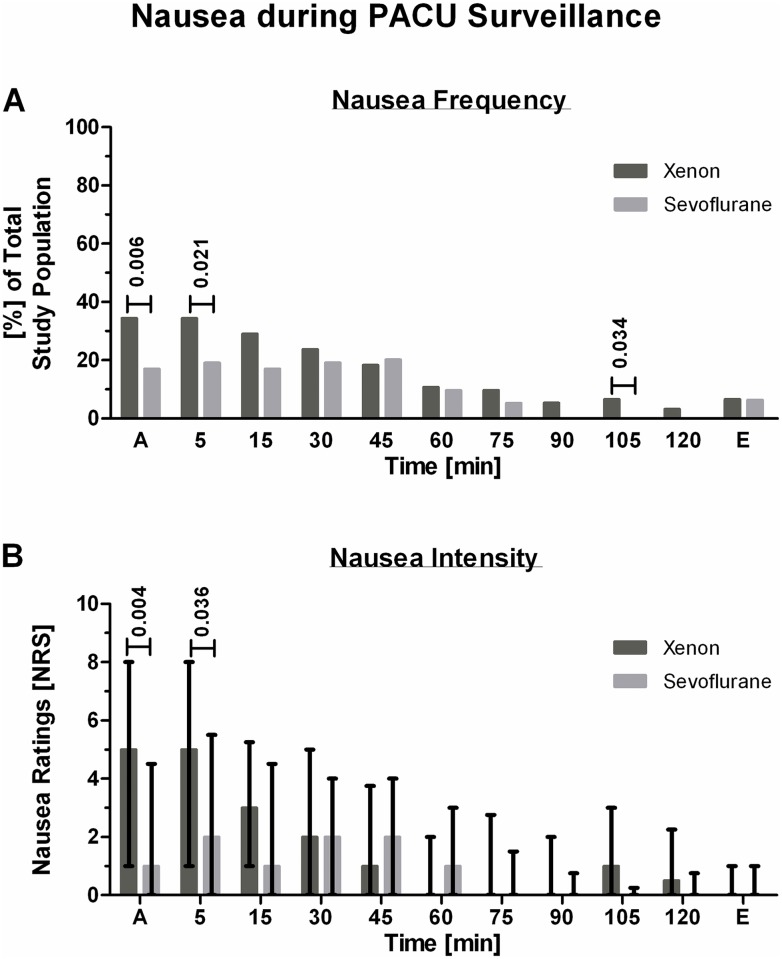
Fig 3. Significant nausea during PACU surveillance.
The timed occurrence of nausea experienced by study participants during their PACU stay is depicted in Fig 3. Fig 3A shows the frequency of significant nausea in study participants, given as percent of total. The nausea intensity ratings of subjects experiencing significant nausea are presented in Fig 3B as medians and quartiles.

