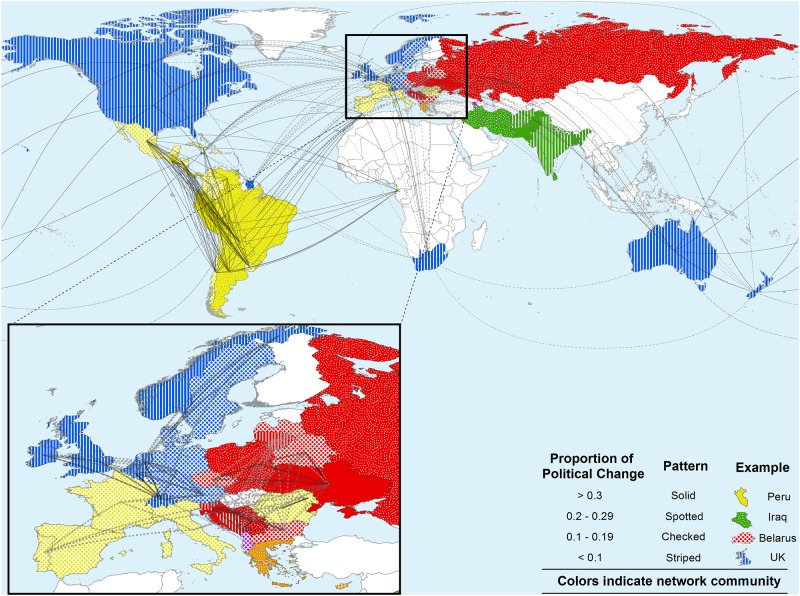
Fig 2. The density of political changes (proportion of intervals with any change in polity score) layered across geography and the socio-linguistic affiliation network.
Network connection thickness is scaled to recency of ancestry. Only the 10 most recent connections are visualized for each country. Depicted network communities were inferred on the socio-linguist affiliation network through the Louvain algorithm [49] as implemented in Gephi [50].

