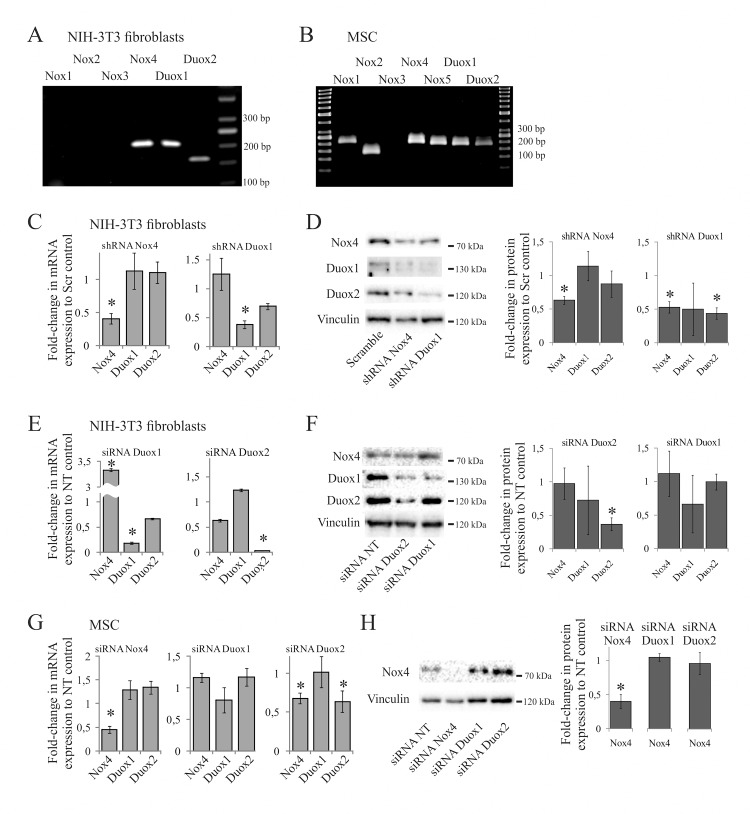
Fig 5. Expression profile and silencing of NADPH-oxidases in mesenchymal cells.
(A)–(B), RT-PCR of NADPH-oxidases in 3T3 fibroblasts and MSC, respectively. Nox5 was not assessed in 3T3 fibroblasts, because it is absent in these cells [30]. (C)–(D), 3T3 fibroblasts were stably infected by shRNAs to Nox4 or Duox1 and analyzed for corresponding mRNA (C) and protein expression (D). The graph shows mRNA expression levels normalized to those in cells expressing scrambled shRNA; (*) p < 0.05 as compared to scrambled controls in 3 independent experiments. (E)–(F), 3T3 fibroblasts were transiently transfected by siRNAs to Duox1 or Duox2 and analyzed for expression of mRNA in 3 independent experiments (E) and Nox4 and Duox1/2 proteins in 2 experiments (F). The mRNA expression levels were normalized to those in cells treated with non-targeting (NT) siRNA; (*) p < 0.05 as compared to NT controls. The western blots are typical of 2 experiments. (G)–(H), MSC were transiently transfected by siRNAs to Nox4, Duox1 or Duox2, and analyzed for mRNA in 3 independent experiments (G), and Nox4 protein expression in 2 experiments (H). The mRNA expression levels were normalized to those in NT controls; (*) p < 0.05 as compared to the NT controls. In this case Duox1/2 protein expression was not significantly altered by corresponding siRNAs (data not shown).

