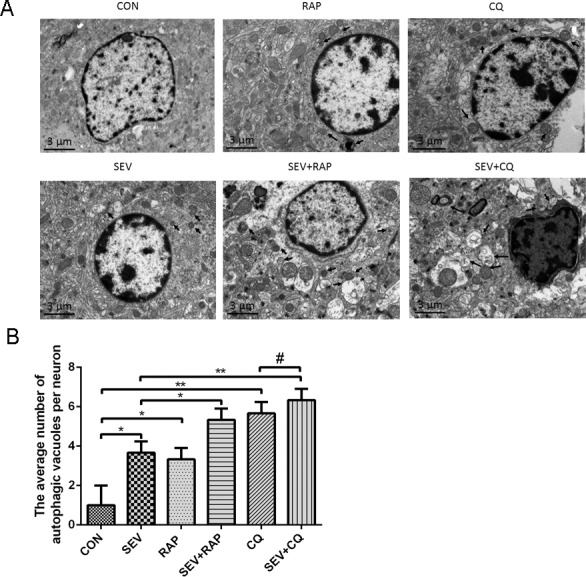
Fig 3. Confirmation of the differences in autophagy in the hippocampal neurons with electron microscopy.

(A)Representative electron micrographs showing autophagic vacuoles in the hippocampus of aged rats in each group, n = 3. (B) Quantitative analysis of the number of autophagic vacuoles per neuron in each group. 3 rats were in each group, and ten cells were examined for each rat. The data are presented as the means±SD. Data are presented as mean ± SD. *P < 0.05 or **P < 0.01.
