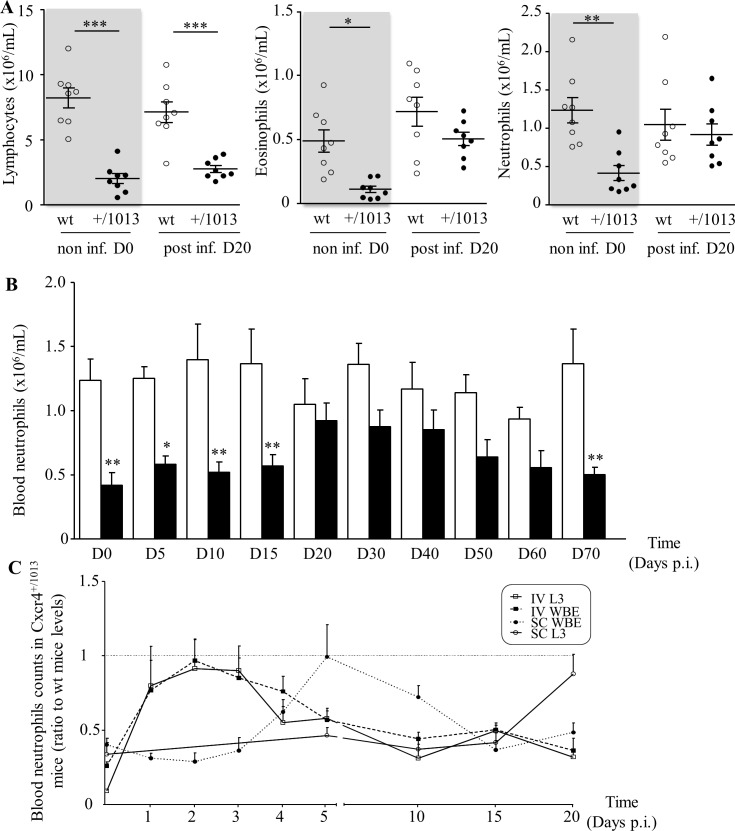
Fig 2. Transient reversion of neutropenia in infected Cxcr4+/1013 mice.
A: Total numbers of lymphocytes, eosinophils and neutrophils were determined on blood smears from non-infected mice at day 0 (non inf. D0) and from subcutaneously infected mice 20 days p.i. (post inf. D20). Open dots and black dots are representing wt and Cxcr4+/1013 mice, respectively (n = 8, each mouse is represented by a dot). Means +/- SEM were at D0 for wt and Cxcr4+/1013, respectively: for lymphocytes 8.21 +/- 0.77 and 2.02 +/- 0.39; for eosinophils, 0.49 +/- 0.09 and 0.11 +/- 0.03 and for neutrophils 1.24 +/- 0.17 and 0.42 +/- 0.1. Differences between wt and Cxcr4+/1013 mice were analyzed by t-test. *: p < 0.05, **: p < 0.01, ***: p <0.001. B: Total numbers of blood neutrophils throughout the course of the filarial infection in infected wt and Cxcr4+/1013 mice (n = 8). Differences between wt and Cxcr4+/1013 mice were analyzed by one-way ANOVA with repeated measures then Bonferroni. *: p < 0.05, **: p < 0.01. C: Blood neutrophils counts in Cxcr4+/1013 mice at different time points upon SC inoculation with either 40 infective larvae (SC L3, ○, plain line) or 10μg L3-derived whole body crude extracts (SC WBE, ●, dotted line) or upon IV inoculation with 40 infective larvae (IVL3, Ƴ, plain line) or 10μg L3-derived whole body crude extracts (IVWBE, ■, dotted line). Neutrophil counts were done over a 20 days’ time period following inoculation and were expressed as ratio to wt mice levels. Ratios close to 1 depict a trend toward normalization of the blood neutrophils counts in the Cxcr4+/1013 mice. Raw data are presented in S2 Table. Results are expressed as mean + SEM, n = 4 to 5 and 8.

