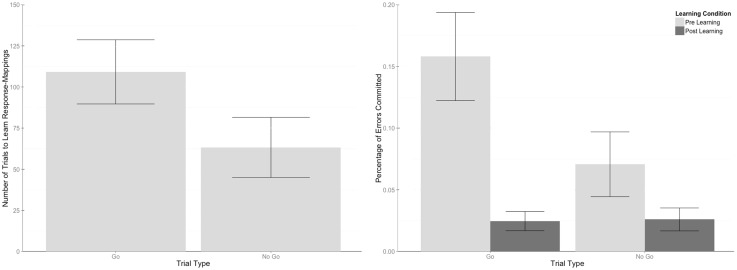
Fig 2. Graphs of trials to learn by trial type and error rate by trial type and learning condition.
(Left) On average, Go stimuli took significantly longer to learn than No Go stimuli. (Right) Error rates for both types of stimuli significantly decreased after the learning criterion was met. However, participants made more errors with Go stimuli than No Go stimuli during the learning period. Once the learning criterion was met, there were no differences in the number of errors committed between the stimulus types.

