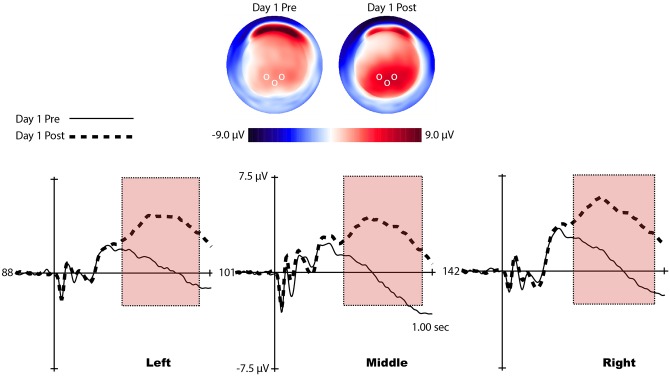
Fig 5. Voltage maps and waveforms of the P3b from representative channels for pre- and post-learning conditions.
(Top) Voltage distributions of the P3b across the scalp for both learning conditions. Clear differences in positive energy can be seen around the occipital region. White circles represent the location of the representative channels shown in the bottom of the figure. (Bottom) P3b waveform (red window) displayed by representative channels from each laterality condition. Clear amplitude differences can be seen between learning conditions.

