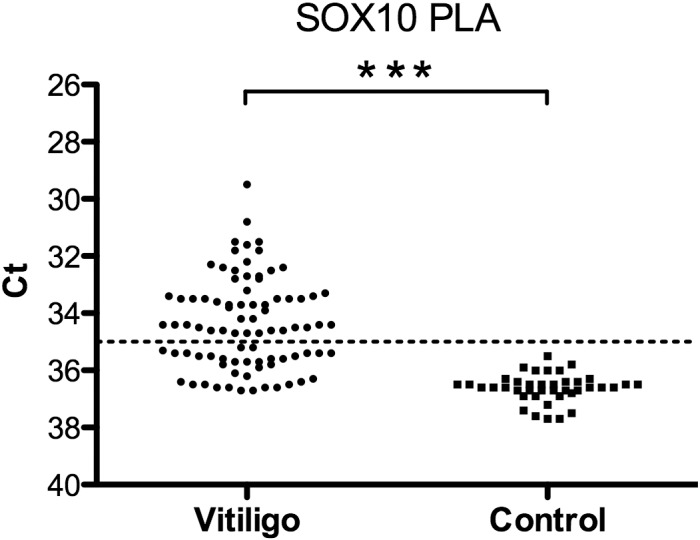
Fig 2. Measurement of SOX10 via solid-phase PLA in sera from vitiligo patients (n = 85) and from controls (healthy blood donors) (n = 40).

Mean Ct (y-axis) values of duplicate samples are shown. For statistical analyses 1-tail two sample heteroscedastic t-test was applied. *** P<0.001. Line indicates cut-off for samples calculated as positive.
