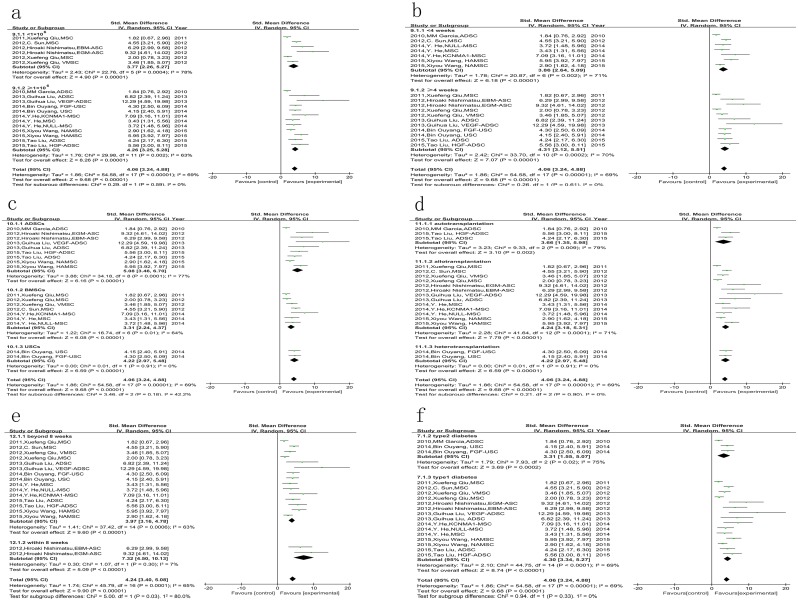
Fig 5. The comparison of the effects on ICP/MAP among different subgroups.
There was no significant difference between the following subgroups: a. number of injected cells <1×10⁶ vs. ≥1×10⁶, P = 0.59; b. follow-up time after stem cell injection <4 weeks vs. ≥4 weeks, P = 0.61; c. stem cell types of ADSCs vs. BMSCs vs. USCs, P = 0.18; d. autotransplantation vs. allotransplantation vs. heterotransplantation, P = 0. 90; f. type1 diabetes vs. type 2 diabetes, P = 0. 33;. e. but the ICP/MAP was higher in the group with the injection of stem cells within 8 weeks than the group beyond 8 weeks, P<0.05.

