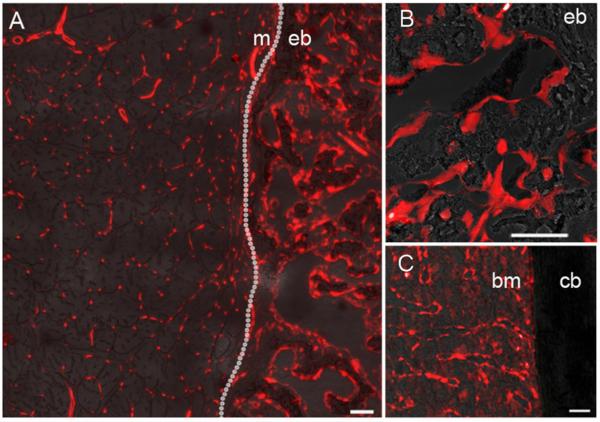
Figure 1.
Confocal fluorescent images of Tie2-lineage cells (tdTomato, red) in rhBMP-2 induced muscle, native bone, bone marrow, and rhBMP-2 induced ectopic bone. Images are shown at the muscle/ectopic bone interface (A) within an ectopic bone nodule (B), and within the native bone of the femur (C). Text labels, m = muscle, eb = ectopic bone, bm = bone marrow, cb = cortical bone. Scale bar = 50 μm.

