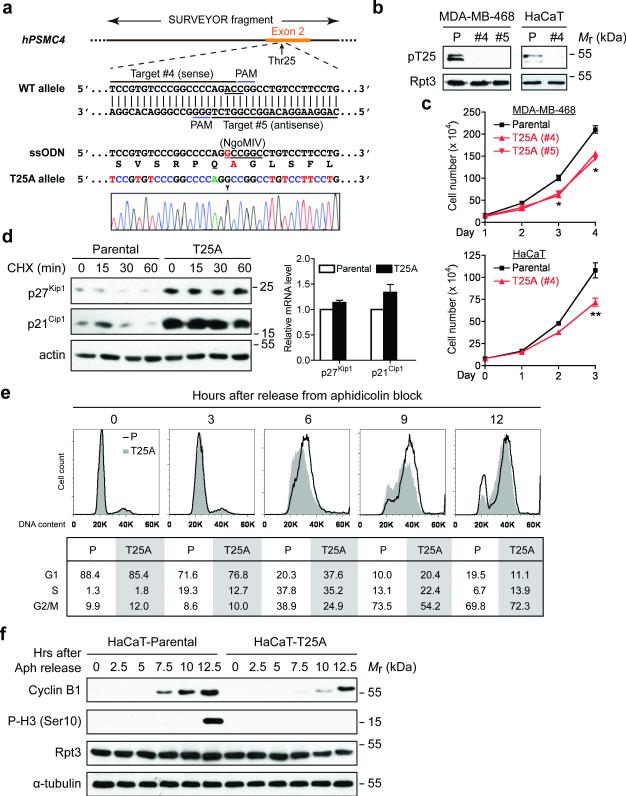
Figure 2. Blockade of Rpt3-T25 phosphorylation impedes cell proliferation.
(a) Guide RNA design and sequencing verification of Rpt3-T25A knock-in using CRISPR/Cas9. The codon of Thr25 (ACC) is underlined in the WT allele. The single point mutation (A→G) is marked by an arrowhead in the sequencing result, and the resulting Ala25 is highlighted in red.
(b) T25A knock-in abolishes T25 phosphorylation. Parental (P) and T25A knock-in clones of MDA-MB-468 cells and HaCaT cells were engineered to stably express Rpn11-TBHA (not shown). After affinity purification, proteasome-associated T25 phosphorylation was probed.
(c) Growth curves of the indicated parental and T25A knock-in cells. Results are mean ± s.e.m. from n=3 independent experiments. **p<0.01, *p<0.05, Student's T-test (paired two-tailed test).
(d) Stabilization of p27Kip1 and p21Cip1 by T25A knock-in. HaCaT cells were enriched at early S phase with 0.4 mM hydroxyurea (HU) treatment then released into regular medium containing cycloheximide for the indicated lengths of time. Protein levels of p27Kip1 and p21Cip1 were determined from total cell extracts (left). No significant difference in their mRNA levels was seen between the parental and T25A cells at the end of HU treatment. Results are mean ± s.e.m. from n=3 independent experiments (right).
(e) Cell cycle analysis of HaCaT cells. After synchronization at G1/S boundary, cells were released and harvested at the indicated time points, stained with propidium iodide and analyzed by FACS. The percentage of cells in G1, S and G2/M phases are shown at the bottom.
(f) HaCaT cells were synchronized and released as in (e). Cell lysates collected at each time point were analyzed by western blot.
Source data for c and e can be found in Supplementary Table 3.

