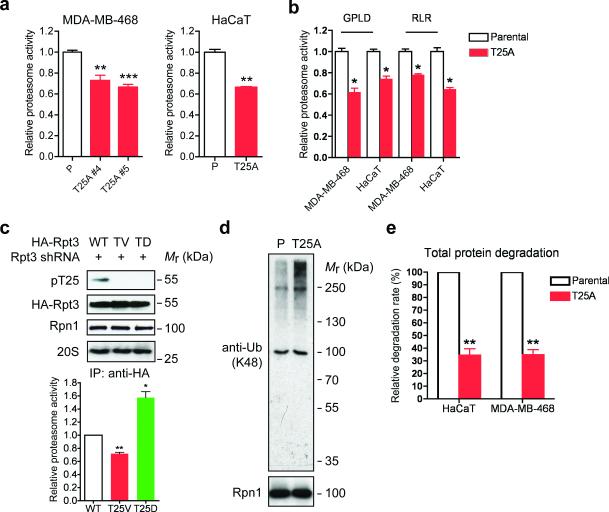
Figure 3. Loss of Rpt3-T25 phosphorylation downregulates 26S proteasome activity.
(a) Proteasome activity in total cell lysates from the indicated MDA-MB-468 and HaCaT cells was measured with Suc-LLVY-AMC. **p<0.01, ***p<0.001 (compared to parental line, two-tailed paired Student's t-test, mean ± s.e.m from n=3 independent experiments).
(b) Proteasome activity was measured as in (a) with Ac-GPLD-AMC (caspase-like activity) or Ac-RLR-AMC (trypsin-like activity) as substrate. *p<0.05, two-tailed paired Student's t-test, mean ± s.e.m from n=3 independent experiments.
(c) 26S proteasomes were isolated by anti-HA IP from the indicated HA-Rpt3-expressing 293T cells. Proteasome components were shown by western blot (top) and proteasome activity from the immunoprecipitates was determined by Suc-LLVY-AMC cleavage (bottom). **p<0.01, *p<0.05 (compared to WT, two-tailed paired Student's t-test, mean ± s.e.m from n=3 independent experiments).
(d) Accumulation of ubiquitinated proteins in T25A cells. Parental and T25A HaCaT cells were enriched at early S phase with 0.4 mM HU treatment, and whole cell extracts were probed for K48-linked ubiquitination. Rpn1 is shown as a loading control.
(e) Total protein degradation rate in parental and T25A knock-in cells was determined by 3H-Phe pulse-chase assay. The protein degradation rates were calculated from n=3 independent experiments and presented as the percentage of that observed in each parental line. **p<0.01 (two-tailed paired Student's t-test, mean ± s.e.m from n=3 independent experiments).
Source data for a, b and c can be found in Supplementary Table 3.

