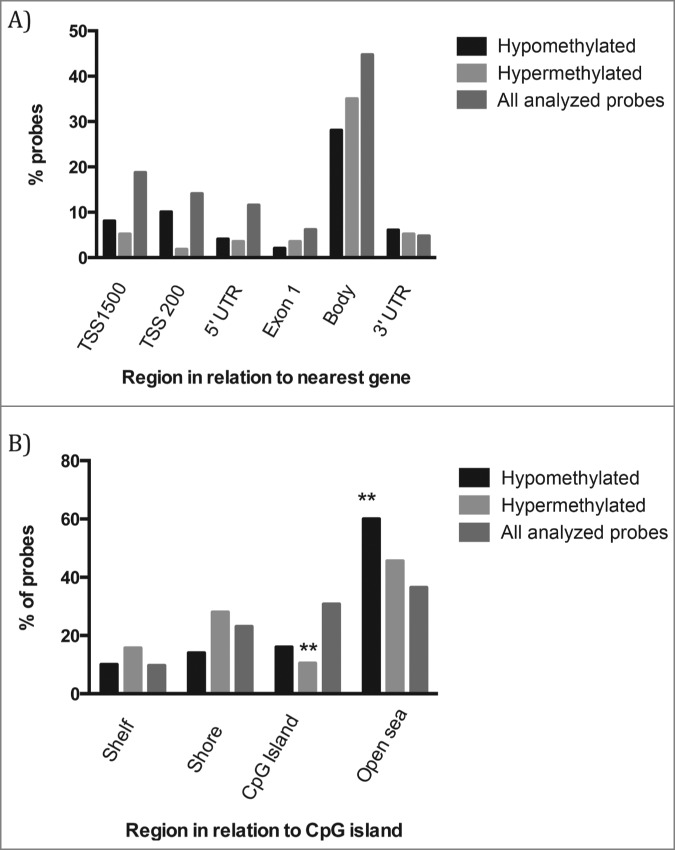
Figure 1.

Distribution of hypo- and hypermethylated DMCpGs versus all analyzed CpGs sites on the Infinium HumanMethylation450 BeadChip in relation to (A) the nearest gene regions; (B) CpG island regions. Chi-square analysis was performed to test for over- or under-representation of sequence features among the DMCpGs. * = P-value < 0.05.
