
Figure 4.
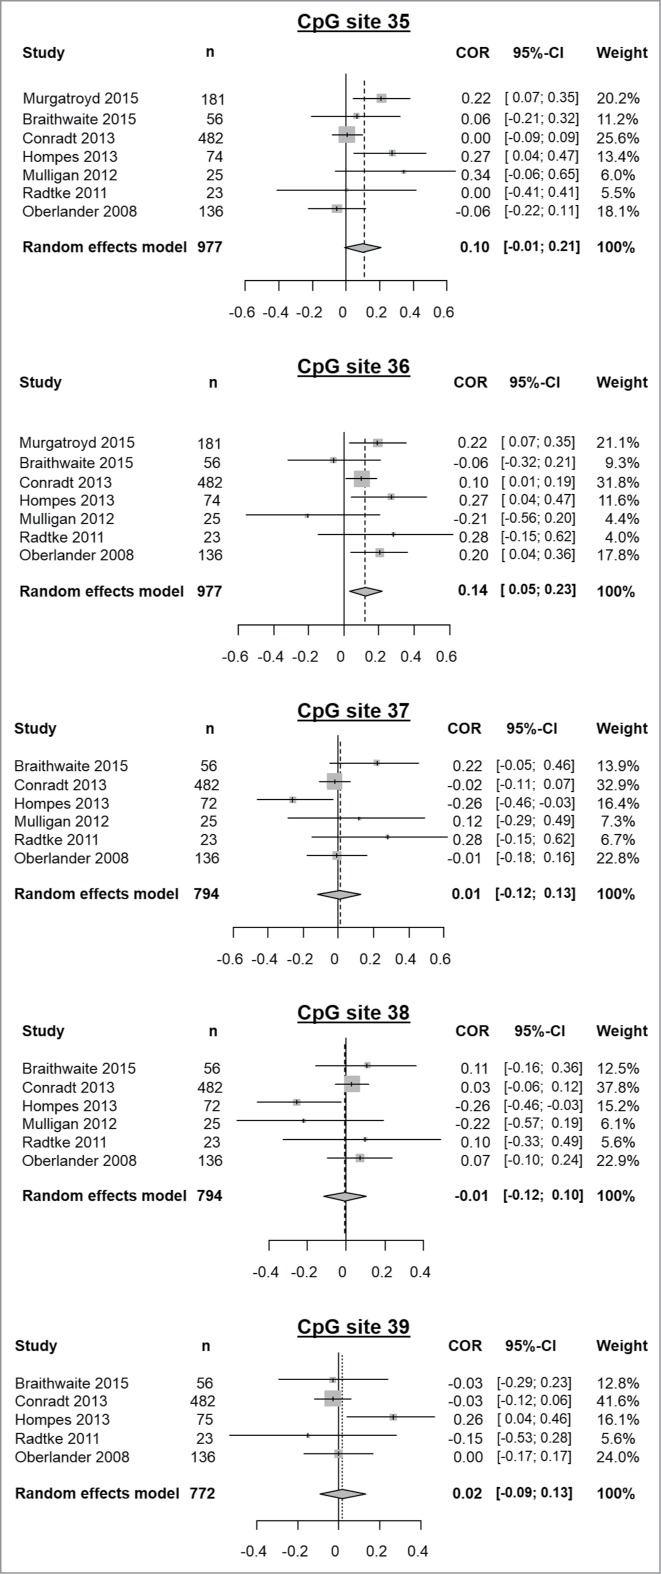
Results of meta-analyses of prenatal stress exposure influence on methylation of the CpG sites 35 to 39. From left to right, displayed variables consist of: study, sample size (n), a graphical representation of the computed correlations, correlation values between methylation and the assessed prenatal stress variable, their corresponding confidence intervals and the weight of each study in the meta-analysis as determined by a random effects model.