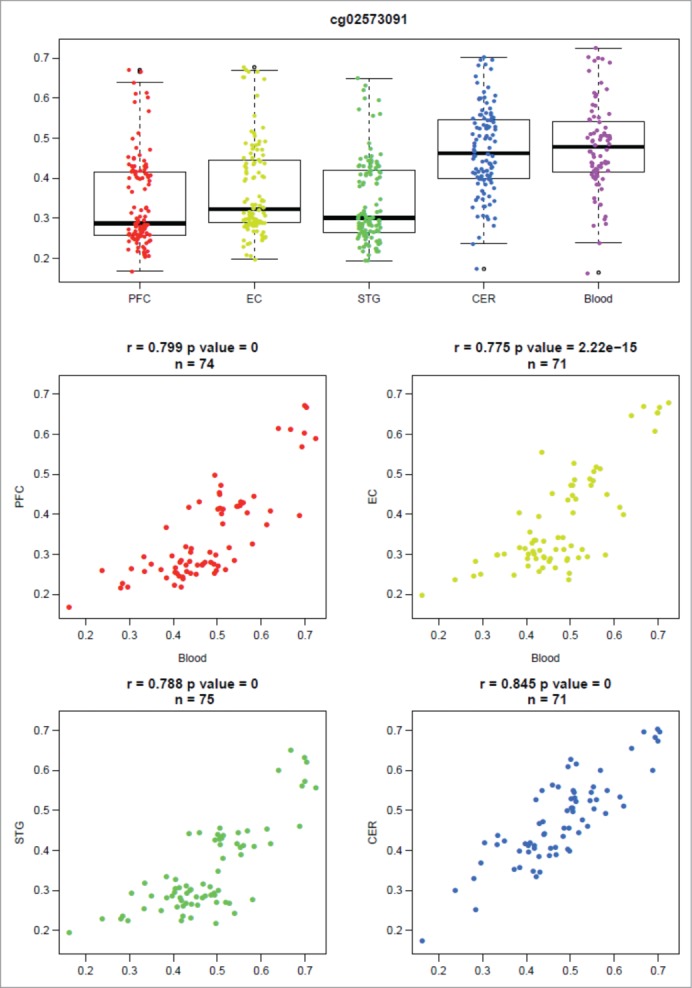
Figure 3.

DNA methylation in whole blood significantly co-varies with that in the brain at some genomic loci. An example output of our online database (http://epigenetics.essex.ac.uk/bloodbrain/) for blood-brain correla-tions at cg26039926. Shown is a boxplot of the distribution of DNA methylation values across all individuals split by tissue and four scatterplots demonstrating the relationship between DNA methylation in whole blood and four brain regions (PFC, EC, STG, CER). At this probe there is a highly significant correlation between individual variation in whole blood and that observed in all four brain regions.
