
Figure 5.
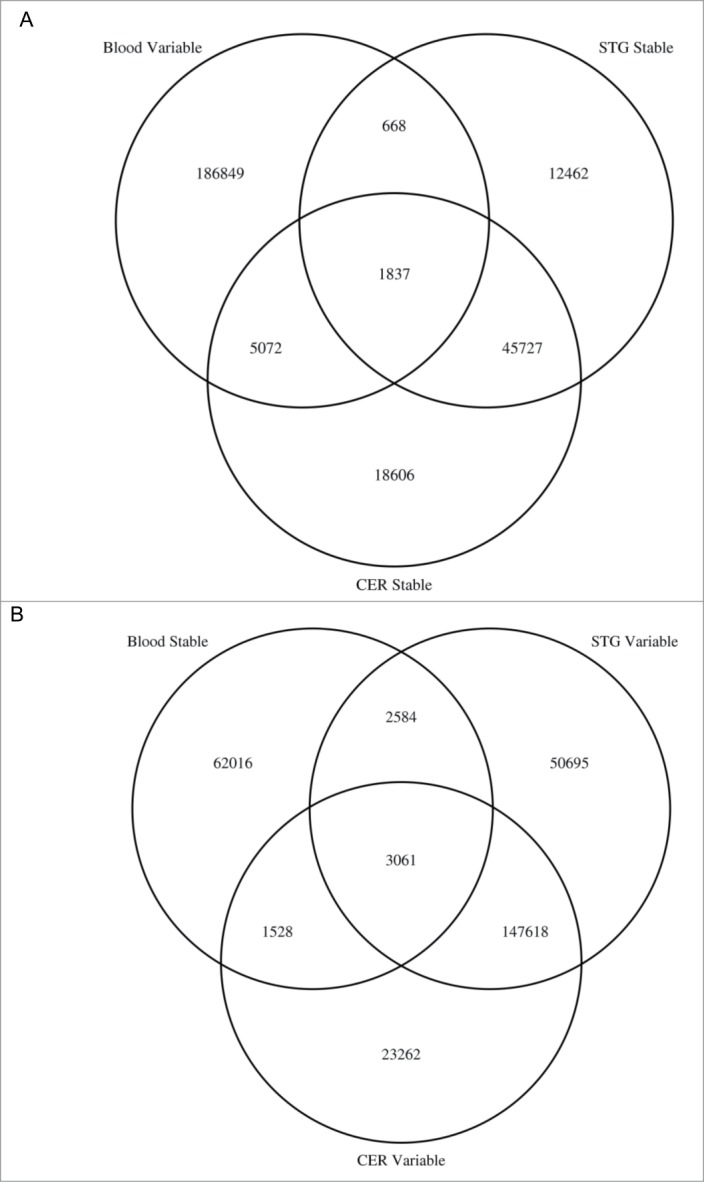
EWAS analyses of brain phenotypes using whole blood DNA may potentially miss disease associated variation and interrogate DNA methylation sites that are not actually variable in the brain. Venn diagrams showing the overlap of DNA methylation sites that are (A) variable in whole blood but not variable in the cortex (STG) or cerebellum and (B) variable in the cortex (STG) and cerebellum but not in whole blood.