
Figure 1.
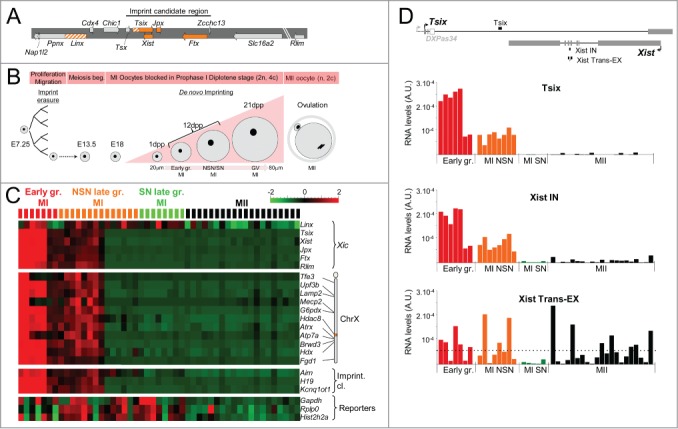
High transcriptional activities within the Xic in early-growing oocytes. (A) Xic map showing the non-coding genes in orange, the non-coding transcription units in hatched orange, and the coding genes in gray. The imprint candidate region described in16 is indicated. (B) Diagram representing the main phases of oogenesis. As early as E13.5, meiosis starts in primordial germ cells. Oocytes are arrested in prophase I at E18 (MI oocytes). Shortly after the birth of female mice, the primary oocytes are incorporated into primordial follicles. Upon follicle recruitment, such primary oocytes enter a growth phase to become fully-grown, GV-stage oocytes reaching prophase I (2n chromosomes, 4c chromatids). At puberty, the induction of ovulation leads to the breakdown of the germinal vesicle (or nuclear membrane), the resumption of meiosis associated with expulsion of the first polar body until the second metaphase (MII oocytes). The mature oocyte (1n, 2c) is then ready to be fertilized. During oocyte growth phase, the volume of the oocyte increases to reach 4-5 times its initial size. At 12 dpp the oocyte population of the ovary consists in a mixture of early-growing and late-growing oocytes that have been identified using a size-based criterion.41,67,68 Ovaries from older (3 to 6-week-old) mice have been used to obtain late-growing oocytes. SN oocytes have been separated from NSN by Hoechst staining. (C) Heatmap showing the levels of primary transcripts both within the Xic, at several X-linked genes and at lncRNAs of imprinted gene clusters in a population of early-growing MI (7), NSN (14) and SN (8) late-growing MI and MII (20) oocytes (129Sv mouse strain). Intronic assays have been used to quantify the primary transcription of coding genes and of lncRNAs when applicable (see Table S1 for primer sequence). For each gene, absolute pre-RNA levels have been normalized by the mean and by the variance across the cell population. The levels of primary transcripts in early-growing oocytes are significantly different from corresponding RNA levels in late-growing MI and MII oocytes (t-test q-value < 10−3). Steady-state levels of 3 housekeeping RNAs (Gapdh, Rplp0, and Hist2h2a), measured using exonic assays, are shown as a control of RNA quality. See also hierarchical clustering of expression profiles and oocyte quality controls in Figure S2. (D) Histograms showing the absolute RNA levels measured using single-cell RT-qPCR at the indicated position in oocytes at different stages. The horizontal dotted line on the histogram marks the average level of spliced Xist RNA on the inactive X-chromosome in female somatic cells.51,69 Above the histograms, the map shows the reciprocal structures of the Xist and Tsix transcripts. The majority of Tsix transcription initiates upstream of the DXPas34 minisatellite.19,27,56 The positions of the RT-qPCR assays used to detect Tsix transcription (Tsix) and primary/spliced Xist transcripts (Xist IN/Xist Trans-EX) are shown as solid bars above and underneath the map respectively. Exons: solid gray boxes; DXPas34: open gray box.