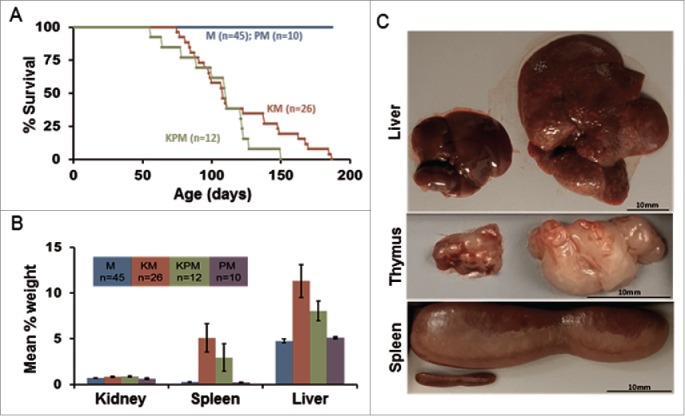
Figure 2.

Gross features of mice expressing the KrasG12D mutation. (A) Kaplan-Meier comparative survival analysis of KM, KPM, PM, and M cohorts. Median survival of KPM and KM mice was significantly less than PM and M cohorts (P< 0.001, log-rank test, for each pairwise combination). (B) Organ weight profiles of KPM, KM, PM, and M cohorts. Spleen and liver percent of body weight was significantly increased in KPM and KM cohorts (P < 0.001, pairwise t-test). (C) Images of hepatomegaly, enlarged thymus, and splenomegaly.
