
Figure 4.
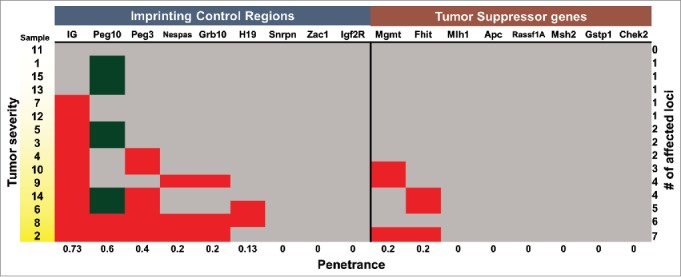
Signature of aberrant DNA methylation in KrasG12D-induced lymphoblastic thymic T-cell lymphoma. Heat map summary of the quantified COBRA data for all ICRs tested in 15 thymic samples. Based on P values from pairwise T-test, each locus tested in the thymic samples was determined to be hypermethylated (red), hypomethylated (green), or not changed (gray). The gradation of yellow in the sample # column depicts progression of the disease state from hyperplastic (white) to atypically hyperplastic to neoplastic (yellow).