
Figure 7.
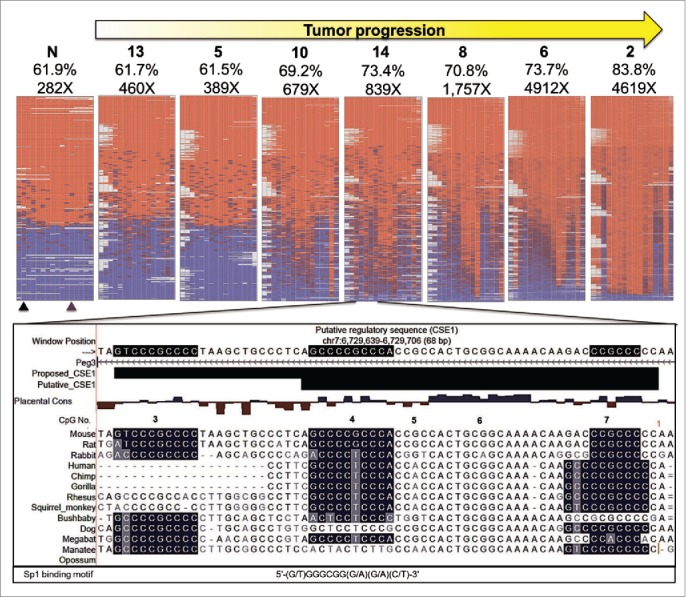
Bisulfite NGS reveals not all CpG are equally vulnerable to DNA methylation changes. Heat maps generated by BiQ analyzer HT showing DNA methylation at each CpG (Nos. One–16) within bisulfite PCR products. Results from the Peg3-ICR are shown as a representative set. Each column represents a CpG within the bisulfite PCR product and each row represents a sequencing read. The positions of the restriction sites utilized in COBRA are indicated below the heat map of the control sample (N) with triangles (black for TaqαI and purple for HphI). Mean methylation (%) and number of reads are presented above each map. Below the heat maps is a UCSC genome browser view of putative CSEl containing CpGs # 4–7. Sequences are highlighted based on matching the consensus motif of the SP1 transcription factor. An expansion of CSE1 is proposed based on the most hypermethylation resistant CpG, # 3, being contained in a highly conserved region that matched very well with the SP1 binding motif and was not included in putative CSE1.