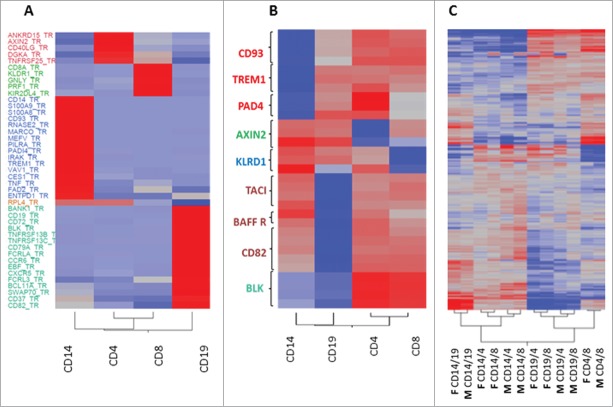
Figure 2.
Validation of cell specific genes confirmed BeadChip results with no significant difference between males and females. Heat plots presenting average RNA expression (A) and DNA methylation (B) with gene names on the Y-axis and cell subsets on the X-axis. (A) The subset-specific expression level of 42 selected subset-specific DEGs was validated in immune cell samples from 5 healthy females, previously analyzed by the BeadArray, and additional RNA samples obtained from 6 healthy males by RT-PCR; the average relative quantification 2−ΔΔCT of each subset is presented. RPL4 was used as a non-subset-specific negative control. Red color indicates increased expression and blue indicates decreased expression in the specific cell subset. (B) The methylation level of 3-5 CpGs within 9 cell subset-specific DMGs was evaluated in immune cell samples from 5 healthy females using the TBS method, and average methylation percentage of each cell subset presented. Red color indicates increased methylation and blue indicates decreased methylation in the specific cell subset. (C) A heat plot presenting differences in methylation level between immune cell subset samples in the BeadArray data set from the 5 females and similar public data from 6 males3. Plot shows 2-way unsupervised clustering of methylation β difference, with red indicating increased methylation and blue indicating decreased methylation between the 2 cell subsets compared (M: male, F: female, followed by the names of cell subsets compared). Cell subset-specific CpG identifier can be found in Tables S6-S9.

