Figure 1.
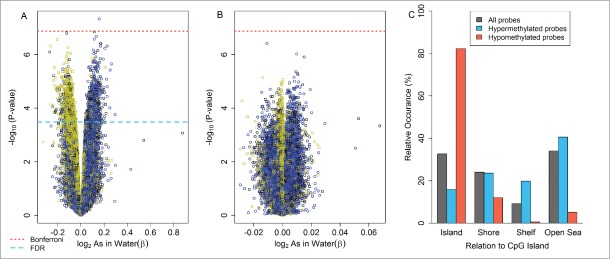
Locus-by-locus epigenome-wide analysis for umbilical artery: volcano plots for the association between log2-transformed maternal drinking water arsenic: (A) unadjusted for cellular heterogeneity and (B) adjusting for cellular heterogeneity using the Houseman reference-free method. (C) Distribution of differentially methylated loci (q-value < 0.05) relative to CpG islands for the unadjusted cell mixture analysis. Volcano plot legend; Yellow: CpG Islands, Black: CpG shore, Blue: CpG shelfs and open sea. Square: Infinium I, Circle: Infinium II †Unadjusted analysis (A) performed on the logit transformed β methylation values (M-values) and adjusted analysis (B) performed on the β sclae methylation levels.

