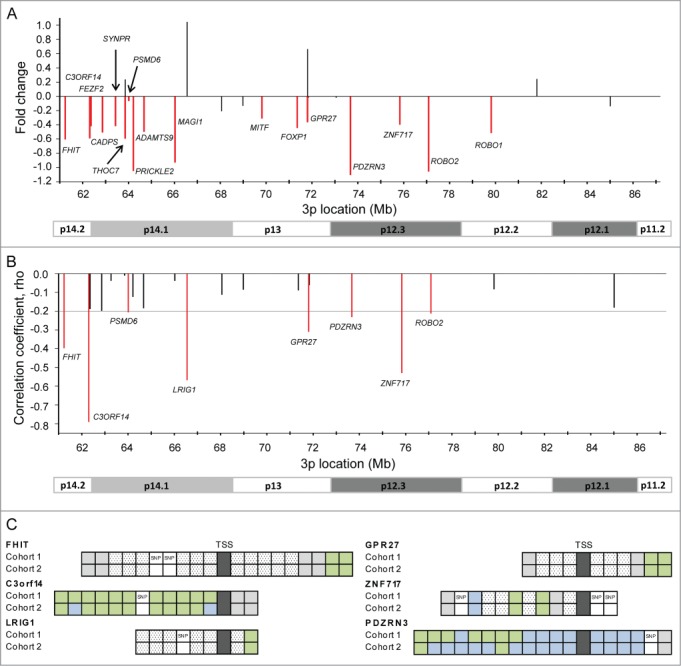
Figure 3.

Identification and validation of silenced genes. (A) Difference in expression of 26 hypermethylated genes between tumors and normal cervical samples. The mean fold change based on 3 external datasets (GSE6791, GSE7803, GSE9750) is shown for each gene. Seventeen genes which were significantly downregulated at an adjusted P ≤ 0.10 in at least one of the data sets are indicated in red and their symbol is listed. (B) Correlation coefficients (rho) from Spearman's rank correlation analysis of methylation (β-value) against expression for 26 hypermethylated genes in 147 cervical tumors (cohort 1). Only negative correlations are shown, and in cases of several methylation and expression probes for the same gene, the most significant probes are presented. The horizontal line indicates the cut-off significance level, corresponding to rho = −0.20 (adj P ≤ 0.10). Eight significant genes are indicated in red and their symbol is listed. (C) Schematic illustration of the CpG sites for 6 significant genes in (B), which were validated in cohort 2. Significant CpG sites are indicated in green (adj P ≤ 0.10) and not significant sites in blue for 147 patients in cohort 1 and 121 patients in cohort 2. Sites in white were filtered during preprocessing due to their location closer than 10 bp from a SNP or low variation across the patients (hatched white; IQR < 0.08). Gray sites were hypermethylated in <10% of the patients. TSS: transcription start site.
