
Figure 4.
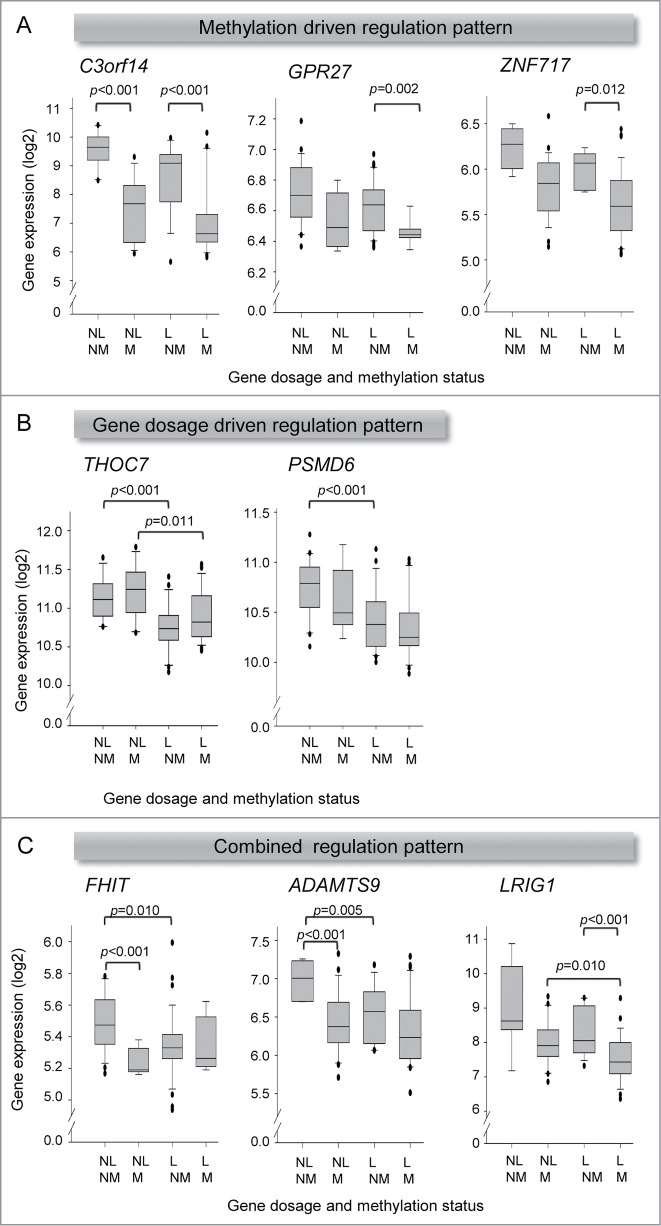
Individual and combined effect of loss and hypermethylation on gene expression. Box plots of gene expression in 4 groups of tumors with different combination of gene dosage and methylation status, demonstrating individual effect of methylation (A), individual effect of gene dosage (B), and combined effect of methylation and gene dosage (C) on gene expression. In total, 73 tumors from cohort 1 were included, for which gene expression, gene dosage, and methylation data were available. NL: no loss; L: loss; NM: not hypermethylated; M: hypermethylated. The median expression value of each group is indicated by the horizontal lines, and the edges of the boxes represent the first and third quartiles. P-values from Welch's t-test are indicated. All indicated differences had an adjusted P ≤ 0.10.