Figure 6.

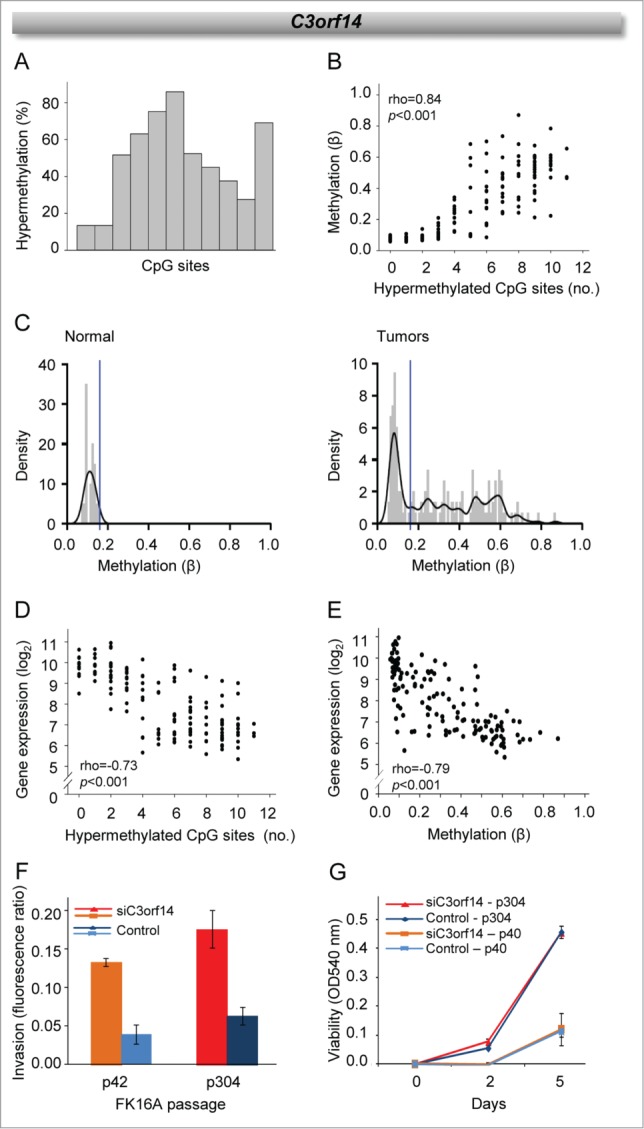
Methylation characteristics and suppressor function of C3orf14. (A) Frequency of cervical cancer patients with hypermethylation of individual CpG sites ordered by location. (B) Methylation (β-value) against number of hypermethylated CpG sites. (C) Density plots (kernel density estimation with band width 0.02, black line; histogram, gray bars) of C3orf14 methylation in normal cervical tissue from GSE46306 (left) and tumors in cohort 1 (right). The blue lines indicate cut-off β-value for scoring hypermethylation. (D) C3orf14 expression against number of hypermethylated CpG sites. (E) C3orf14 expression against methylation (β-value). Invasion (F) and cell viability (G) of control and C3orf14 siRNA treated FK16A cells at early (p40/42) and late (p304) passages. The columns and bars show the mean and standard deviation of triplicates for one representative experiment for each passage. The difference between siRNA treated and control cells was significant for invasion (p42: P = 0.010, p304: P = 0.006, t-test), but not for cell viability. In B, C, and E, methylation data of the CpG site correlating most strongly with gene expression were used. In B, D, and E, correlation coefficient (rho) and P-value in Spearman's rank correlation analysis are indicated. In A-E, data from cohort 1 are presented; similar results were found for cohort 2.
