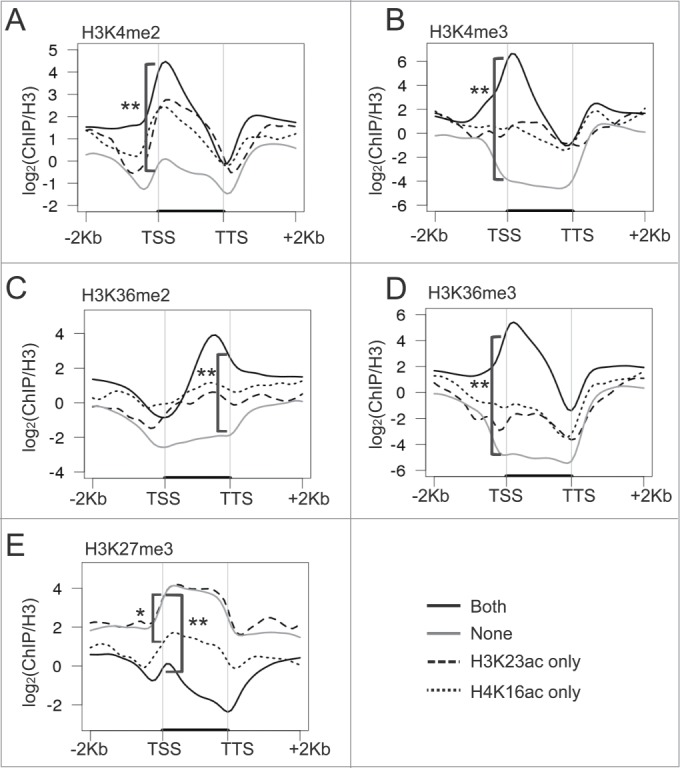
Figure 4.

Correlation of histone methylation marks with H4K16ac and H3K23ac. Metaplots show the correlation of genes in the 4 clusters with H3K4me2 (A), H3K4me3 (B), H3K36me2 (C), H3K36me3 (D), and H3K27me3 (E). Four gene clusters were defined in Figure 2B. The * indicates P < 0.01 and ** indicates P < 2.2 × 10⁻¹⁶.
